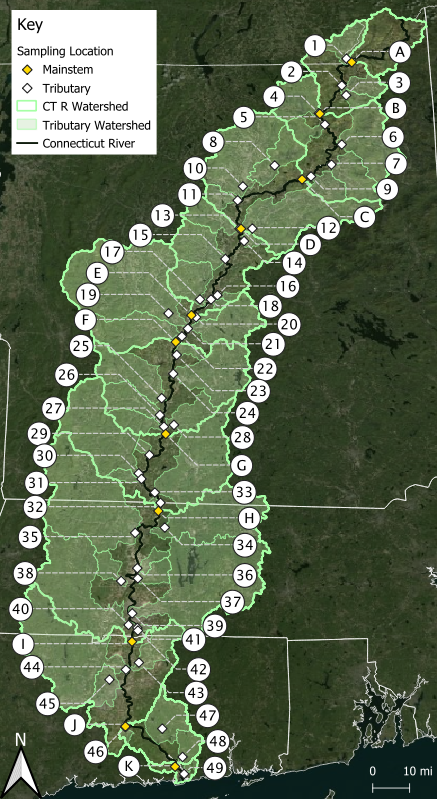
Sampling Location Details
1 Tributary sites keyed on map by numbers and mainstem sites by letters
2 Site ID is the unique identifying code given to a site location by a monitoring organization
Samplepalooza was an annual, one day, synoptic monitoring event throughout the entire Connecticut River Watershed. Teams of volunteers and professionals visited locations covering more than 1,000 river miles across four states. Samples were tested for the nutrients nitrogen and phosphorus. Chloride was also included in some years.
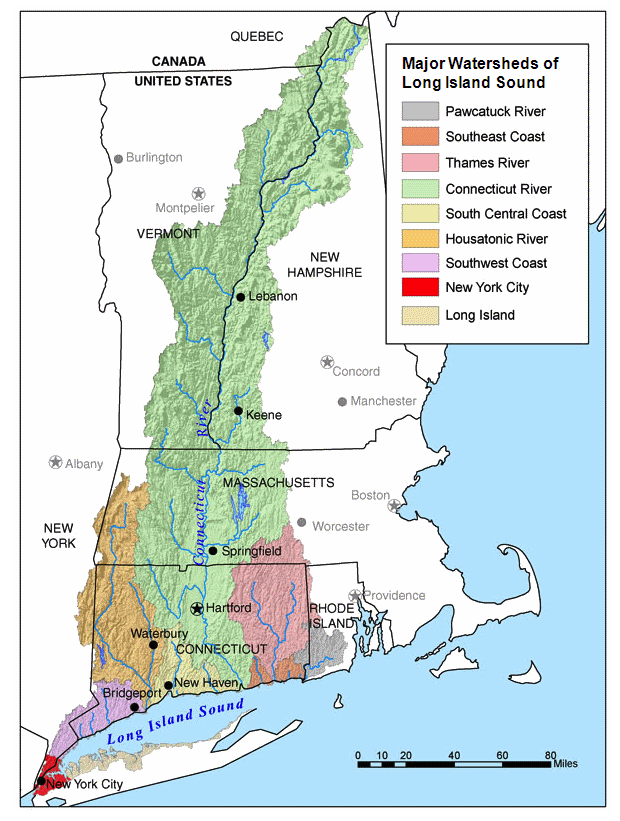
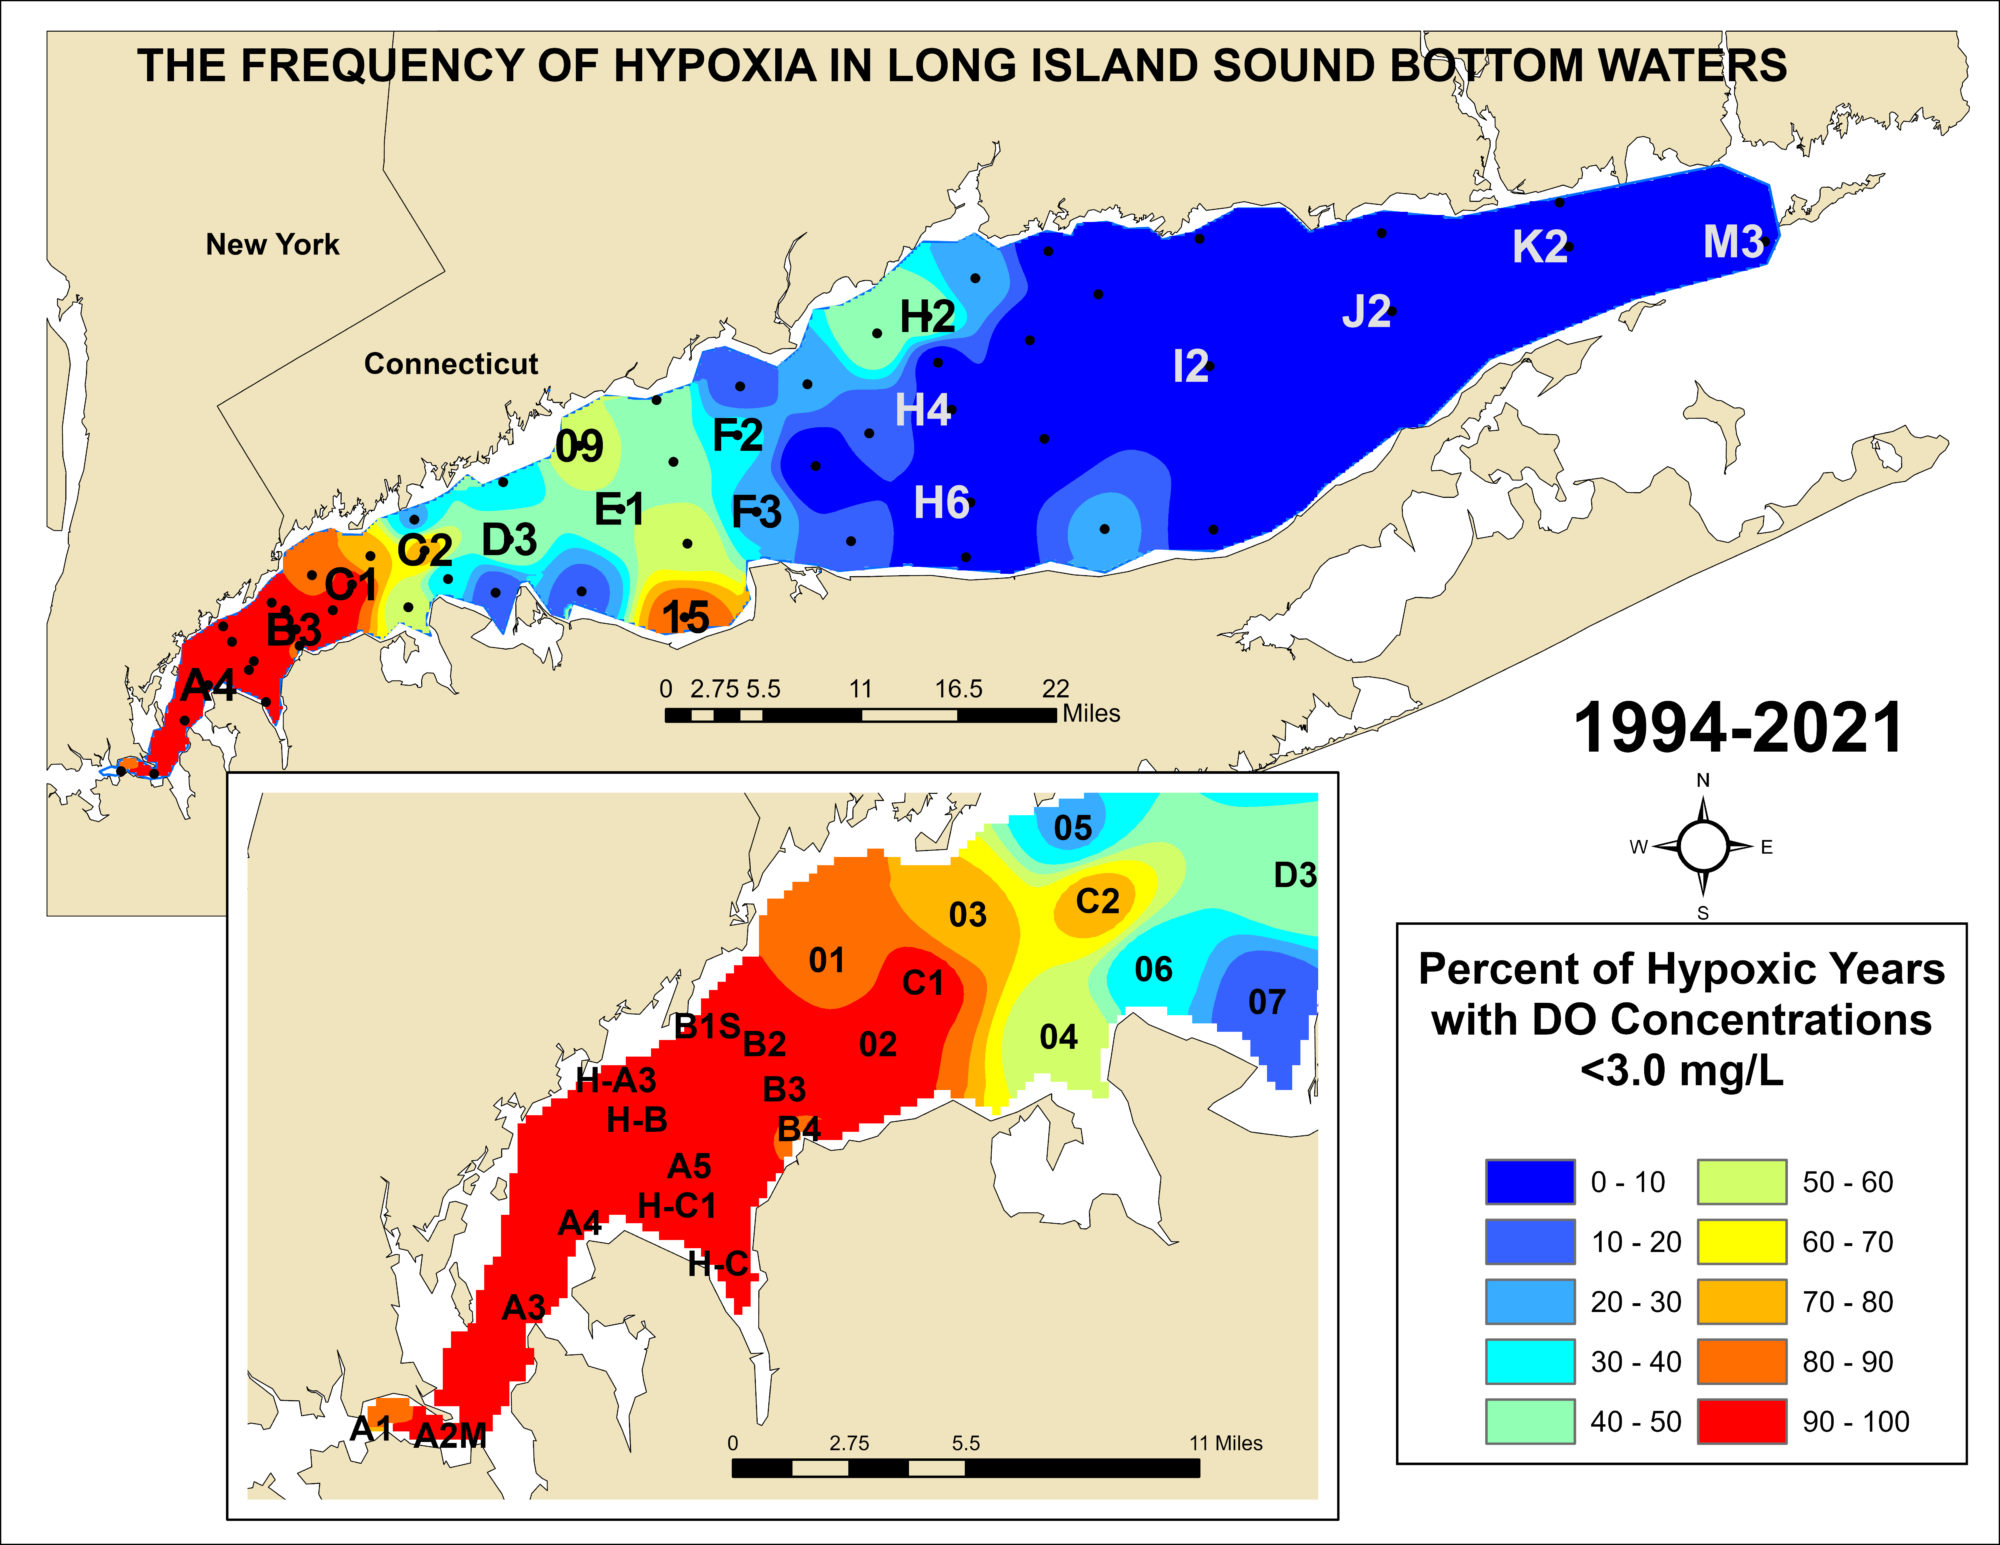
Samplepalooza was a coordinated effort led by the Connecticut River Conservancy (CRC) to collect data in support of a multi-state effort working to reduce nitrogen pollution in Long Island Sound. Nitrogen from the Connecticut River and other rivers entering the Sound has been determined to be the cause of the anoxic “dead zone” documented by researchers in the Long Island Sound. Excess nitrogen causes large amounts of algae to grow. As the algae dies, it depletes the water of dissolved oxygen that is critical for aquatic wildlife. The states of Connecticut and New York have made many strides to reduce the amount of nutrients going into Long Island Sound. The upstream states find this project useful to help identify the primary areas of elevated nutrients in their watersheds.
The strategy behind Samplepalooza was to sample a large geographic area simultaneously, ideally a day with low flows and little precipitation in all four states. This approach would allow for more accurate comparisons to be made among samples while minimizing differences in weather and river flow variation—issues that usually complicate such studies. The project was designed to identify areas of the watershed that provide the largest sources of nutrients and contribute to the knowledge base required for more accurate targeting of efforts to reduce nutrient impacts. Sampling locations were selected on the main stem of the Connecticut River and the downstream sections of its major tributaries and minor tributaries of concern. In the case of tidal tributaries, sites were usually selected above the tidal section to eliminate the need to sample on an outgoing tide.
Sampling throughout the watershed is impossible for just one organization to do. A huge thank you to the Black River Action Team, Chicopee 4 Rivers Watershed Council, Deerfield River Watershed Association, Eightmile River Wild & Scenic Watershed, Farmington River Watershed Association, Fort River Watershed Association, Friends of Lake Warner, New Hampshire Department of Environmental Services, Salmon River Watershed Partnership, Scantic River Watershed Association, Southeastern Vermont Watershed Alliance, Vermont Agency of Natural Resources, Vermont Association of Conservation Districts, and Woodard & Curran for their participation in Samplepalooza over the years of the project.
Samplepalooza was first held on August 6, 2014 as a collaboration between CRC, New Hampshire Department of Environmental Services (NH DES), and Vermont Department of Environmental Conservation (VT DEC). The following year, Yale University and the New England Interstate Water Pollution Control Commission (NEIWPCC) joined the effort and it was held on September 10, 2015. During the first two years, in an attempt to ensure low flow sampling throughout the watershed at all sites, several dates were selected by the committee, and a final decision on sampling was made one to two days out based on weather predictions and recent flows. The project lost momentum after the first two years and was on hiatus until revived in 2018. We decided to move away from the committee model and to select the date ahead of time to simplify preparation and make it easier for everyone to participate fully. Samplepalooza was then held on September 20th, 2018, September 12th, 2019, September 17th, 2020, and concluded in 2021. We decided not to continue this project after 2021 with the knowledge that the United States Geological Survey (USGS) and several state agencies are working to thoroughly characterize nutrient contributions throughout the Connecticut River watershed in a more thorough and detailed way than our yearly snapshot every could.
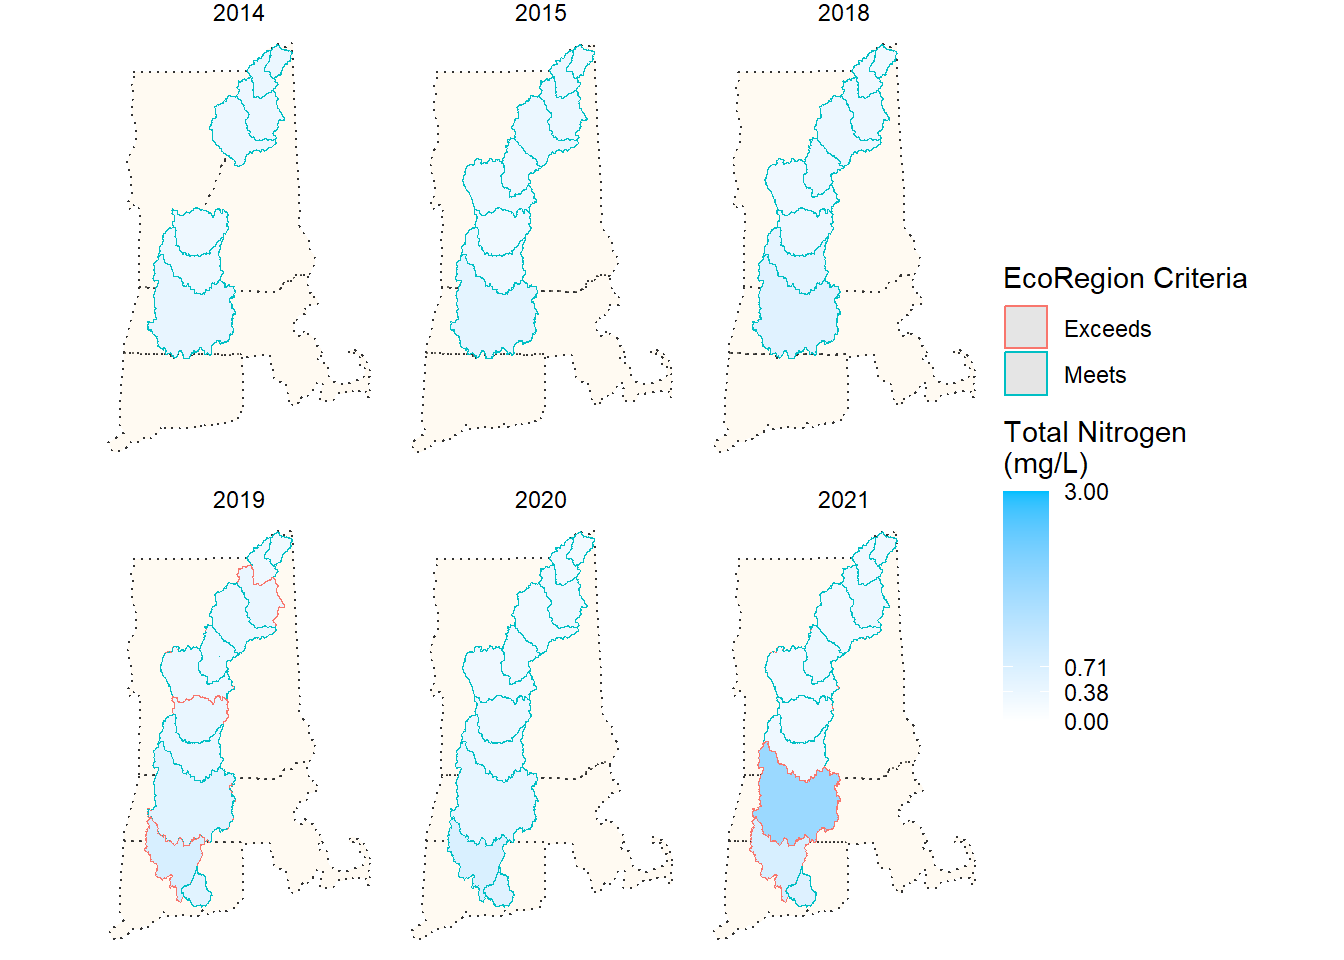
Total nitrogen (TN) tests for nitrogen in all its forms, including nitrate (NO3-), nitrite (NO2-), ammonium (NH4+), and as part of organic matter. Nitrogen is an essential nutrient for plants and can be found in the atmosphere as well as all living beings. It is also a key component of many fertilizers. An overabundance of nitrogen in our waterways can contribute to eutrophication (overgrowth of algae) and anoxia (lack of oxygen) in saltwater systems, such as Long Island Sound. Nitrogen levels can also contribute to eutrophication in freshwater systems that also have high phosphorus levels.
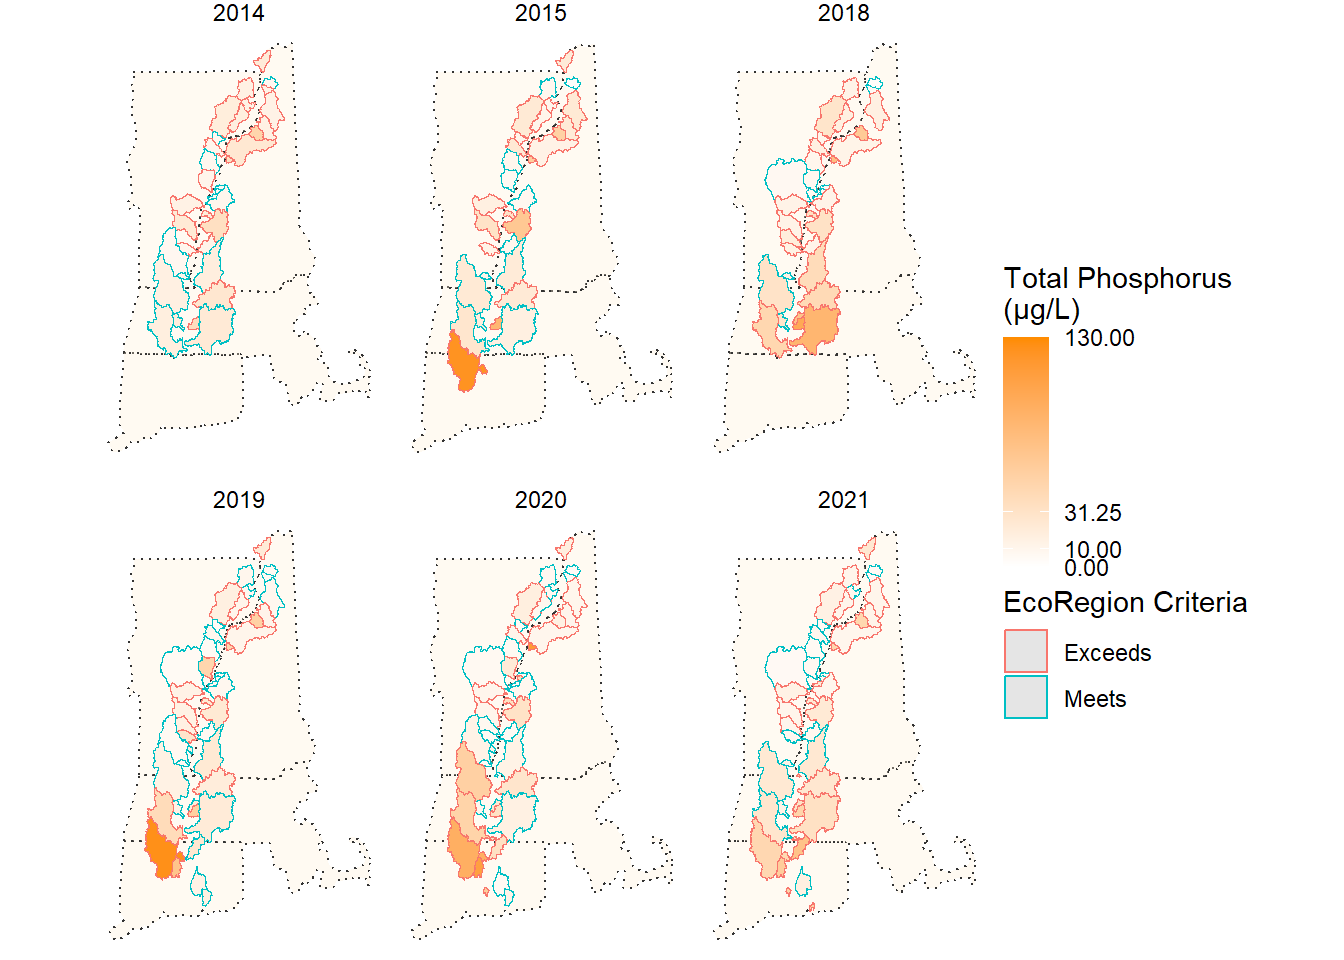
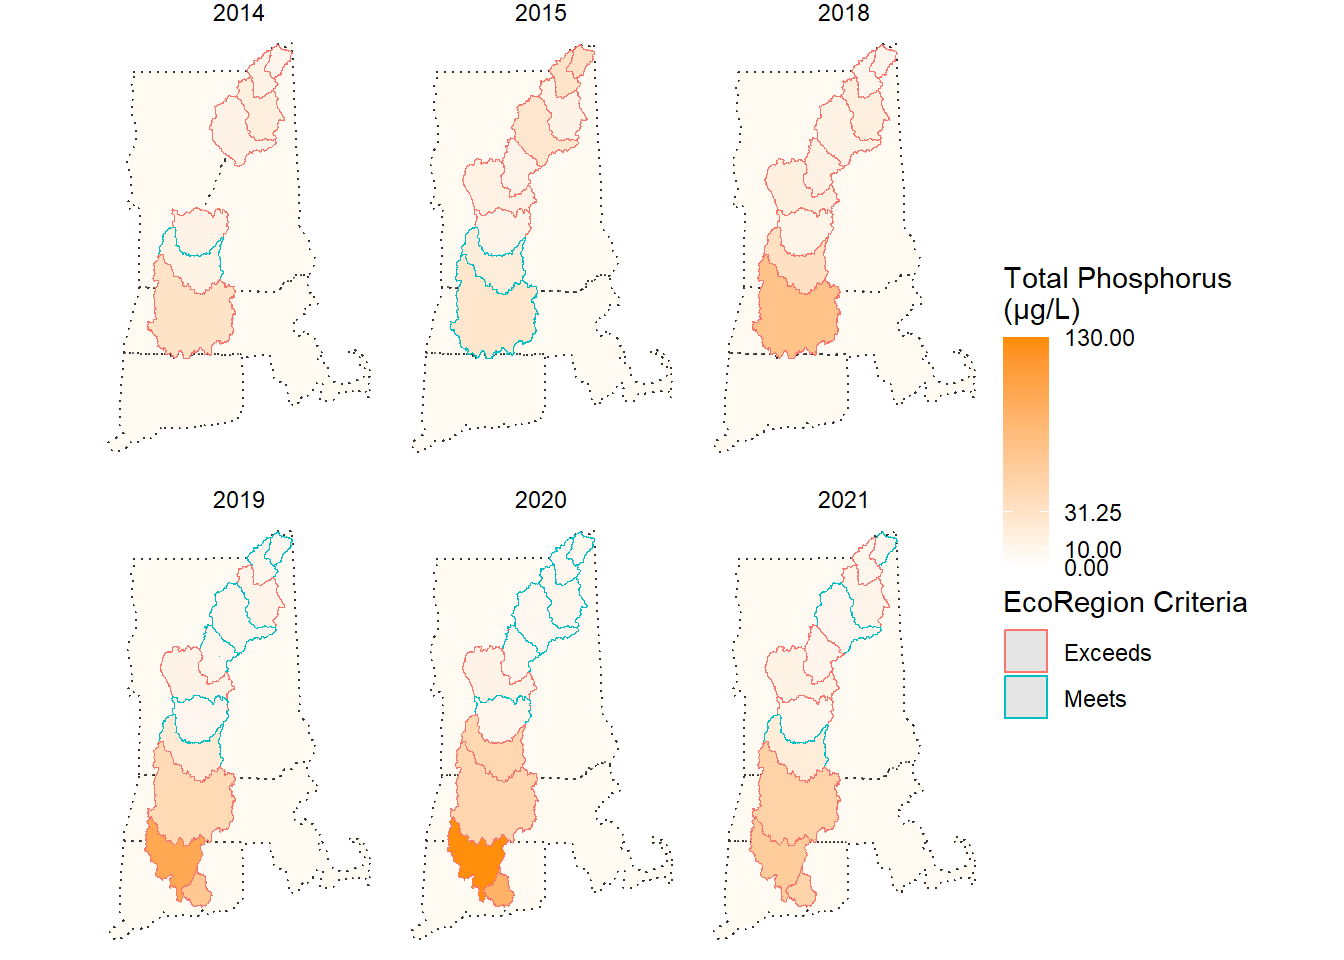
Total phosphorus (TP) tests for phosphorus in all its forms, including organic and inorganic phosphates (PO4-3). Organic phosphates are those that are bound to plant or animal tissue and formed primarily through biological processes, but they may occur from the breakdown of organic pesticides. Inorganic phosphates include orthophosphates, produced in natural processes and found in sewage, and polyphosphates, used in treating boiler waters and in detergents. An overabundance of phosphorus in our waterways can contribute to toxic algae blooms, eutrophication, and anoxia in freshwater systems, such as lakes and ponds. Phosphorus levels can also contribute to eutrophication in saltwater systems that also have high nitrogen levels.
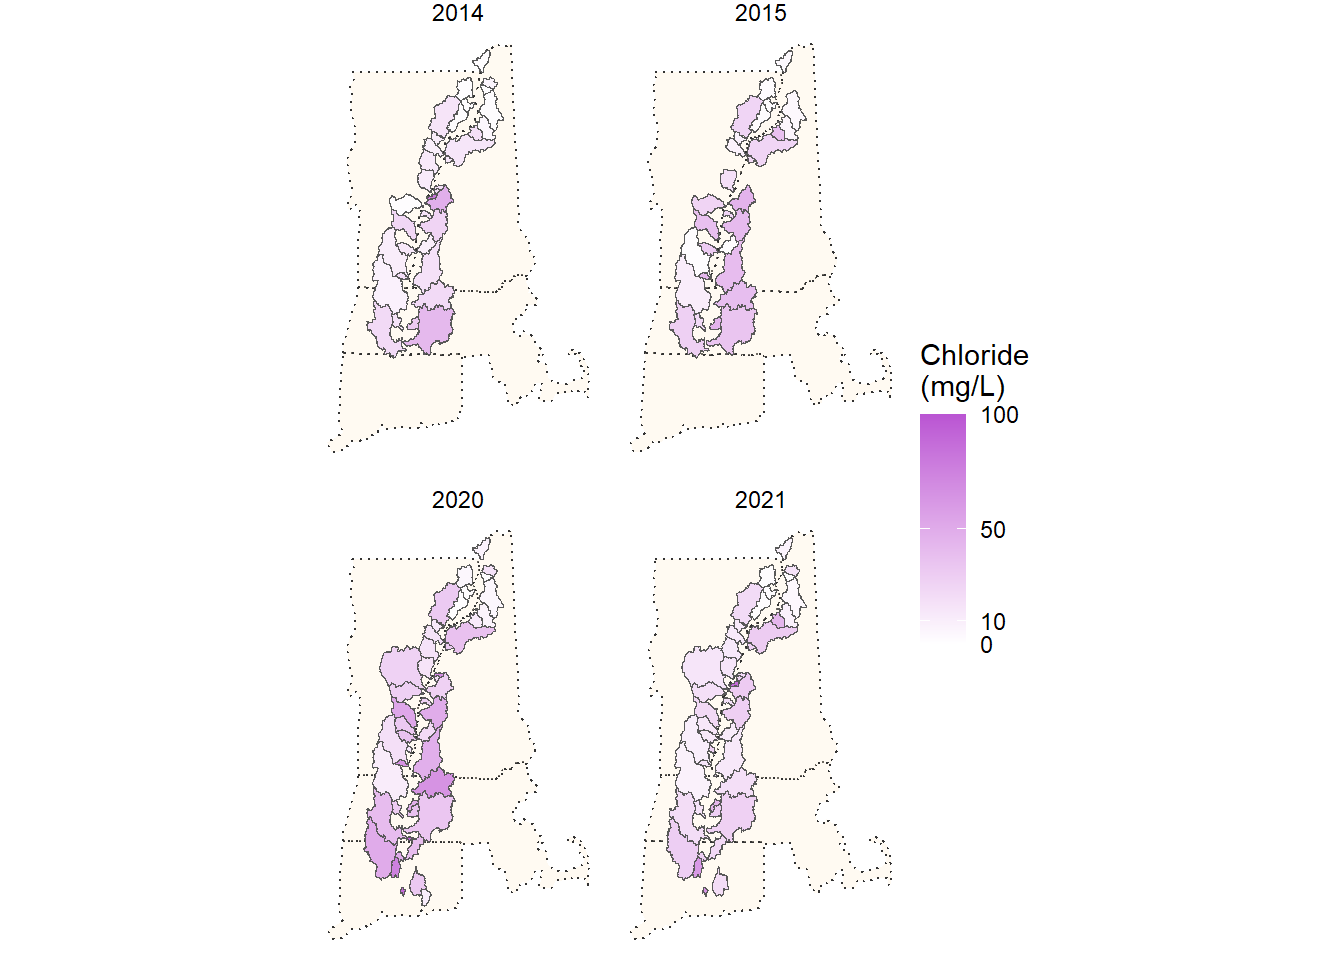
Chlorides (Cl) are naturally found in both salt and fresh water environments. Chloride ions separate from chloride salts, such as sodium chloride (table salt), potassium chloride, or magnesium chloride. Concentrations of chlorides in the environment have increased sharply since the widespread adoption of using road salts as a deicer starting in the 1970s. Chlorides can also come from water softener discharge, wastewater effluent, fertilizers, or dust inhibitors used on dirt roads in the summer. Chloride concentrations tend to be higher in areas with lots of pavement and other treated surfaces. High chloride concentrations in freshwater systems can stress or kill aquatic plants and animals.
Nitrogen and phosphorus loading into lakes, rivers, estuaries, and wetlands can cause and/or contribute to water quality problems in many areas across the world. Excessive amounts of these nutrients can result in algae or vegetative blooms, benthic algal mats, slime layers on rocks, poor water clarity, aquatic habitat degradation for other plants and animals, and impairment of drinking water supplies. Nutrient effects such as eutrophication of downstream systems from upstream loads, human-health effects of excessive nutrient loads in water supplies, effects on recreational use and aesthetics, and impact on aquatic biota have all received national news attention. Recently, we have experienced an increased number of algae blooms in the Connecticut River and its tributaries each summer.
The Connecticut River is the largest contributor of freshwater to the Long Island Sound (LIS). Excess nitrogen loading has been identified as the critical contributor to water quality impairments in Long Island Sound, namely low dissolved oxygen (DO) levels, or hypoxia. To address the hypoxia, the Connecticut Department of Energy and Environmental Protection (CTDEEP) and New York State Department of Environmental Conservation (NYSDEC) developed a Total Maximum Daily Load (TMDL) that identified nitrogen loading reductions necessary to meet water quality standards in the Sound. The U.S. Environmental Protection Agency (EPA) approved the LIS TMDL in 2001. In 2005, EPA indicated that the out of basin (MA, VT, NH) load reduction targets had been met.
In 2015, the Connecticut Fund for the Environment and other partner groups filed a petition with the EPA and state agencies to review, amend, or re-issue the Long Island Sound Total Maximum Daily Load (TMDL) because the 2001 TMDL efforts were not sufficient to meet water quality standards. EPA announced a new Nitrogen Reduction Strategy for Long Island Sound (LIS) in 2016. The US EPA intends to identify point source and nonpoint nitrogen reduction options based upon ecological thresholds developed using existing data from a variety of sources, including locations throughout the LIS watershed. However, there is significant concern that this data set is incomplete and not representative of sufficient locations and hydrologic conditions necessary to develop scientifically based nitrogen reduction targets.
The data collected as part of Samplepalooza is intended to contribute to the body of knowledge that is used by EPA and other agencies to set ecological thresholds, loadings, and effluent limits for the Connecticut River watershed and assist the states that are in the process of updating their nutrient water quality standards. Finally, Samplepalooza brought together partners from throughout the watershed to form partnerships in anticipation of future efforts working across state lines to address water quality concerns.
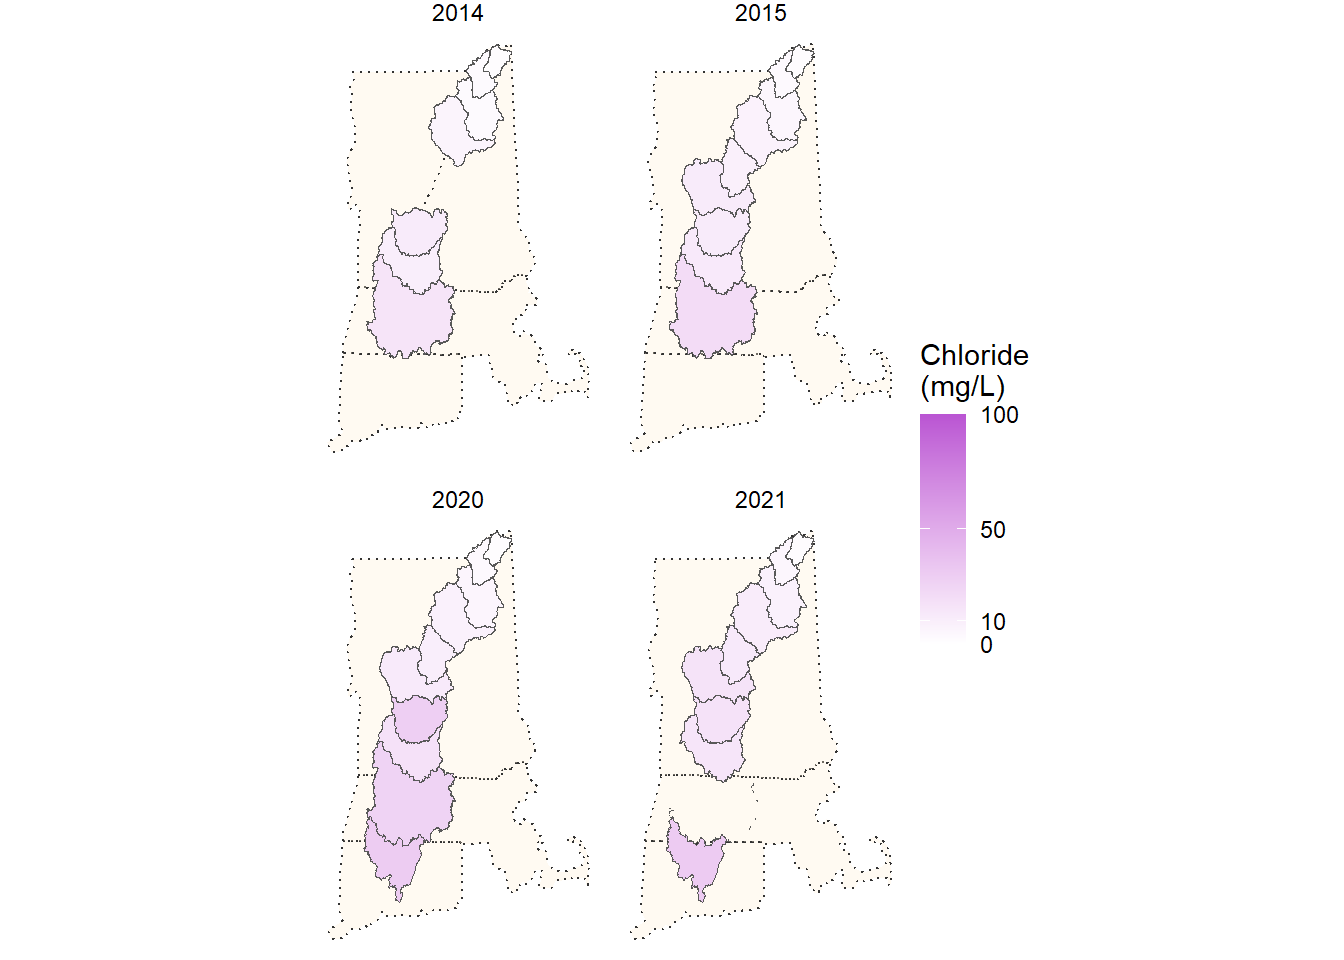
Chloride was sometimes included to take advantage of the widespread sampling event to also gain an understanding of how chloride levels compare across the region, especially during summer low flows when impacts of road salts are expected to be at their lowest.
There were a few additional sampling locations included in 2014 & 2015 as part of some other simultaneous data collection efforts, but those locations and their results were not included in this report because they did not meet the main criteria for Samplepalooza locations and were not sampled after 2015.
The samples collected were tested for the concentration of each parameter and the results are presented as milligrams (mg) or micrograms (μg) per liter (L). Measuring concentrations can help us understand if a body of water is suitable for aquatic life. They do not always show the impact of each tributary on its receiving body of water (where the water next flows into, in this case either the Connecticut River or Long Island Sound).
There are two challenges with comparing nutrient (N & P) results across the entire Connecticut River watershed. The first is that the watershed is so large geographically that we would not expect to see the same natural background levels of nutrients throughout the entire region. That is, if there were no humans changing the land or altering the natural nutrient cycles, there would still be lower levels of nutrient concentrations as you go north and up in elevation within the watershed, and higher levels as you move south and down in elevation. The other challenge is that the watershed includes four different states, each with their own way of regulating whether a body of water is considered impaired or not. Some of these states have numeric criteria to compare results to, while others have narrative criteria that depends on a specific condition being caused by elevated nutrients (i.e. eutrophication) in order to consider a river “impaired.”
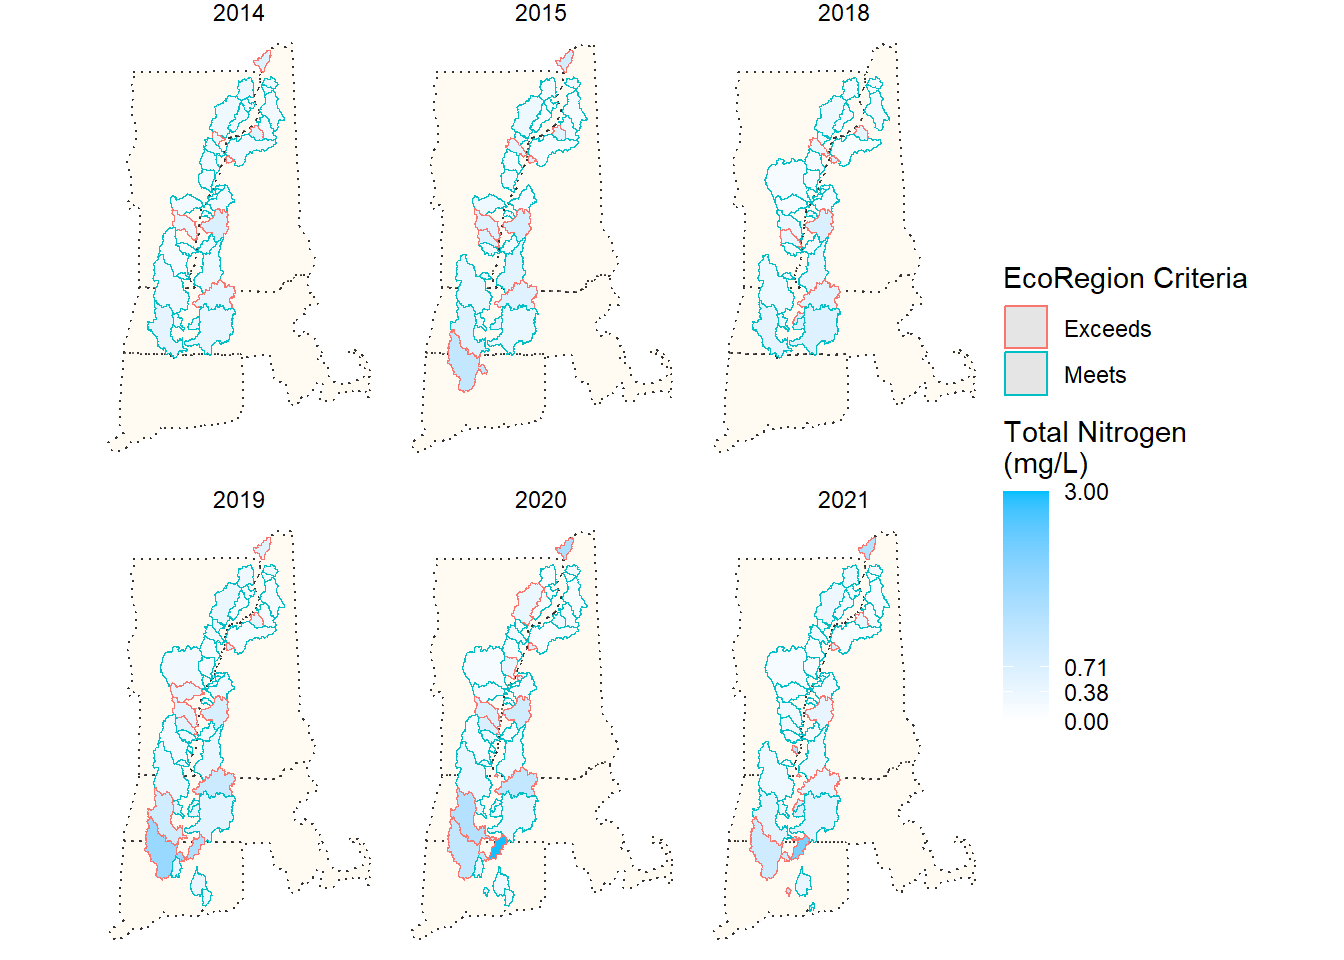
In the early 2000s, the US EPA released a series of ambient water quality recommendations for nutrient criteria by ecoregion. These recommendations are based on actual samples collected throughout each region. These are stringent, scientifically based, and consistent across state lines, so they are the criteria we are choosing to compare the results to. The Connecticut River watershed falls into two ecoregions: “VIII: Nutrient Poor Largely Glaciated Upper Midwest And Northeast” and “XIV: Eastern Coastal Plains.” The recommendations for ecoregion VIII are 0.38 mg/L for TN and 10.00 µg/L for TP. The recommendations for ecoregion XIV are 0.71 mg/L for TN and 31.25 µg/L for TP. These thresholds are used in the charts below.
On a final note, all of these samples are single grab samples. We acknowledge that they may not be fully representative of the larger bodies of water. The goal of this project is not to assess water, rather to provide a unique look at a watershed scale.
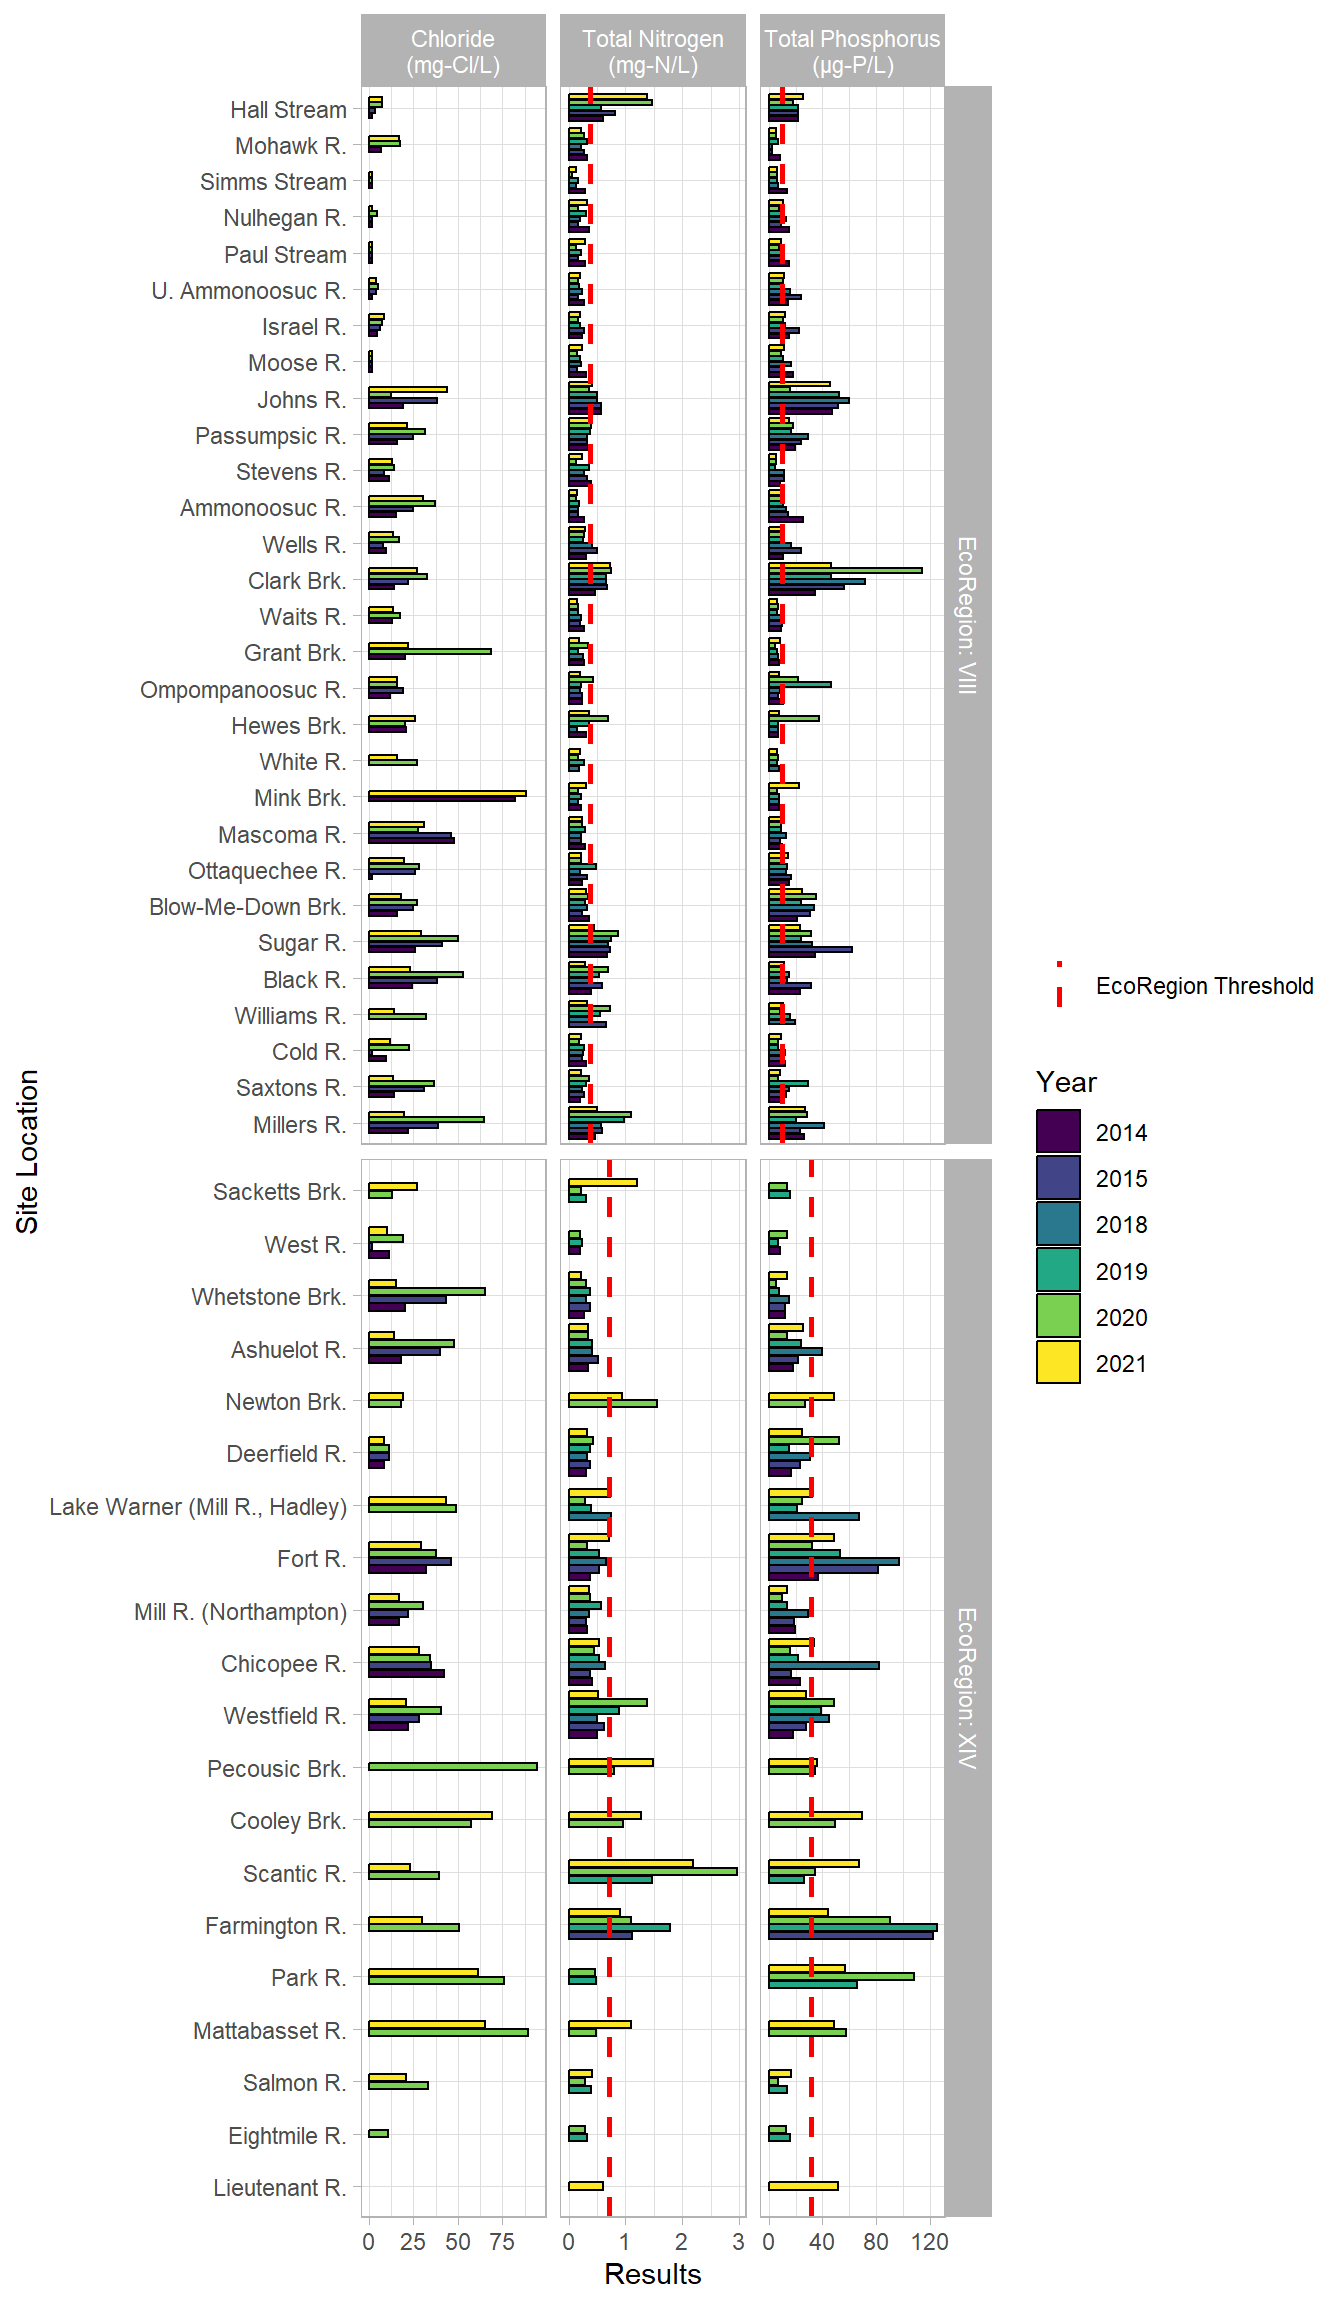
The chart above has the tributaries arranged from north to south within each EcoRegion with a dotted line to indicate the recommended EPA threshold for the indicated parameter. A reminder that there is no threshold for chloride within the range presented.
Some notable standouts include Mink Brook, and the tributaries between the Westfield River and the Mattabasset River for chloride; Hall Stream, Clark Brook, the Scantic River and the Farmington River for nitrogen; and Johns River, Clark Brook, Fort River, Farmington River, and Park River for phosphorus.
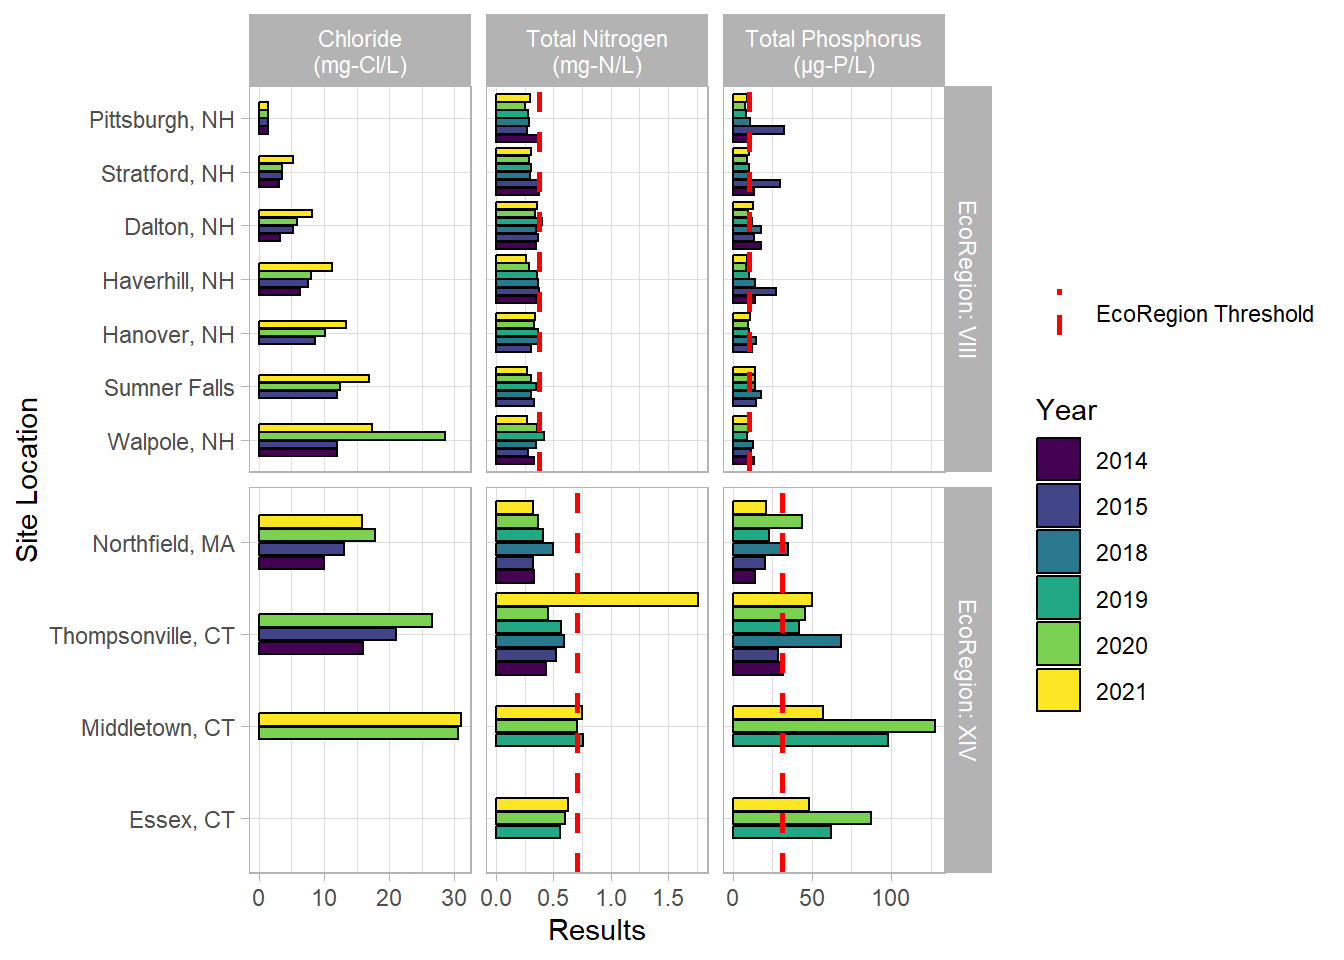
The chart above has the mainstem sampling locations arranged from north to south within each EcoRegion with a dotted line to indicate the recommended EPA threshold for the indicated parameter. A reminder that there is no threshold for chloride within the range presented.
We are unsure why the Thompsonville, CT, sample in 2021 came back so high for nitrogen, but there is no reason to suspect the sample as invalid.
Here is the same data from above presented on a map to show you the watershed of each tributary or the portion of the mainstem captured at each site:
Tributaries each have different flows and watershed size and do not contribute equal amounts of water and therefore equal amounts of nutrients to the system by concentration. Concentration (amount per volume of water) can be multiplied by flow (volume of water per time unit) to get a loading value (amount per time unit) that allows a more accurate comparison of impact among tributaries. Loading values for the mainstem are not presented here due to the complex flow regime of a river that has both significant hydropower regulation and a long tidal portion.
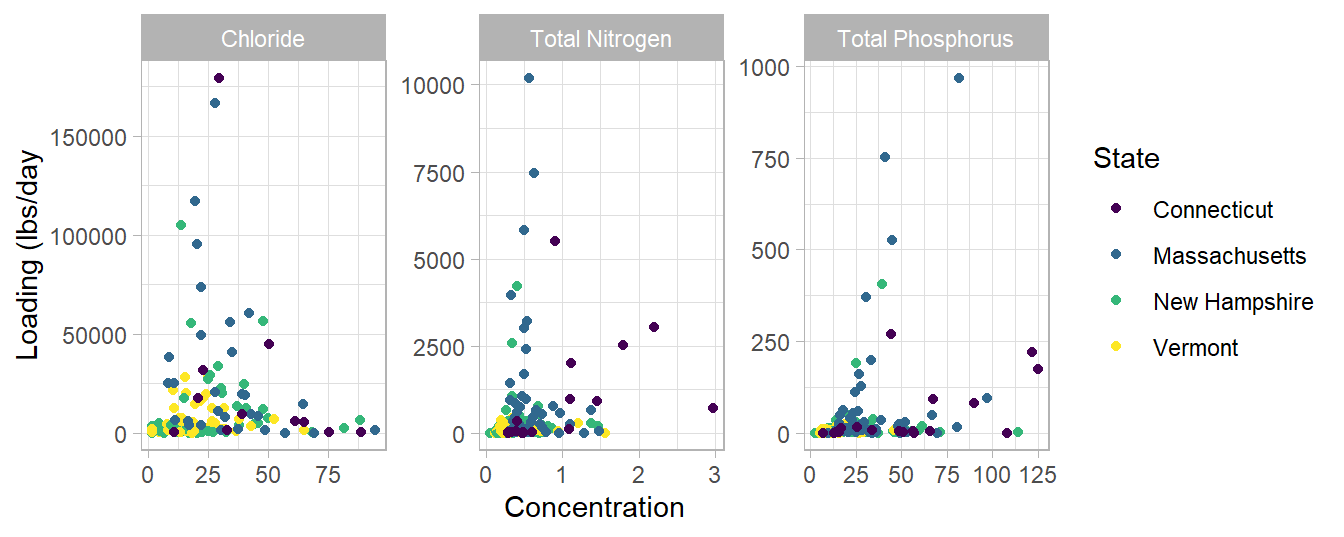
This graph shows the concentration versus the loading of each tributary sample. It is interesting to note that most of the sites with the highest loading of each parameter do not have the highest concentrations, especially with chloride. That is because the largest rivers may have lower concentrations due to dilution. That is why it is important to review not only concentration but also loading.
If we wanted to direct restoration efforts on particular tributaries, those efforts should be targeted to watersheds that fall in the upper right quadrant of these graphs to have the biggest impact, since they are contributing the largest amount of the parameter to the system with the highest amount in each unit of water.
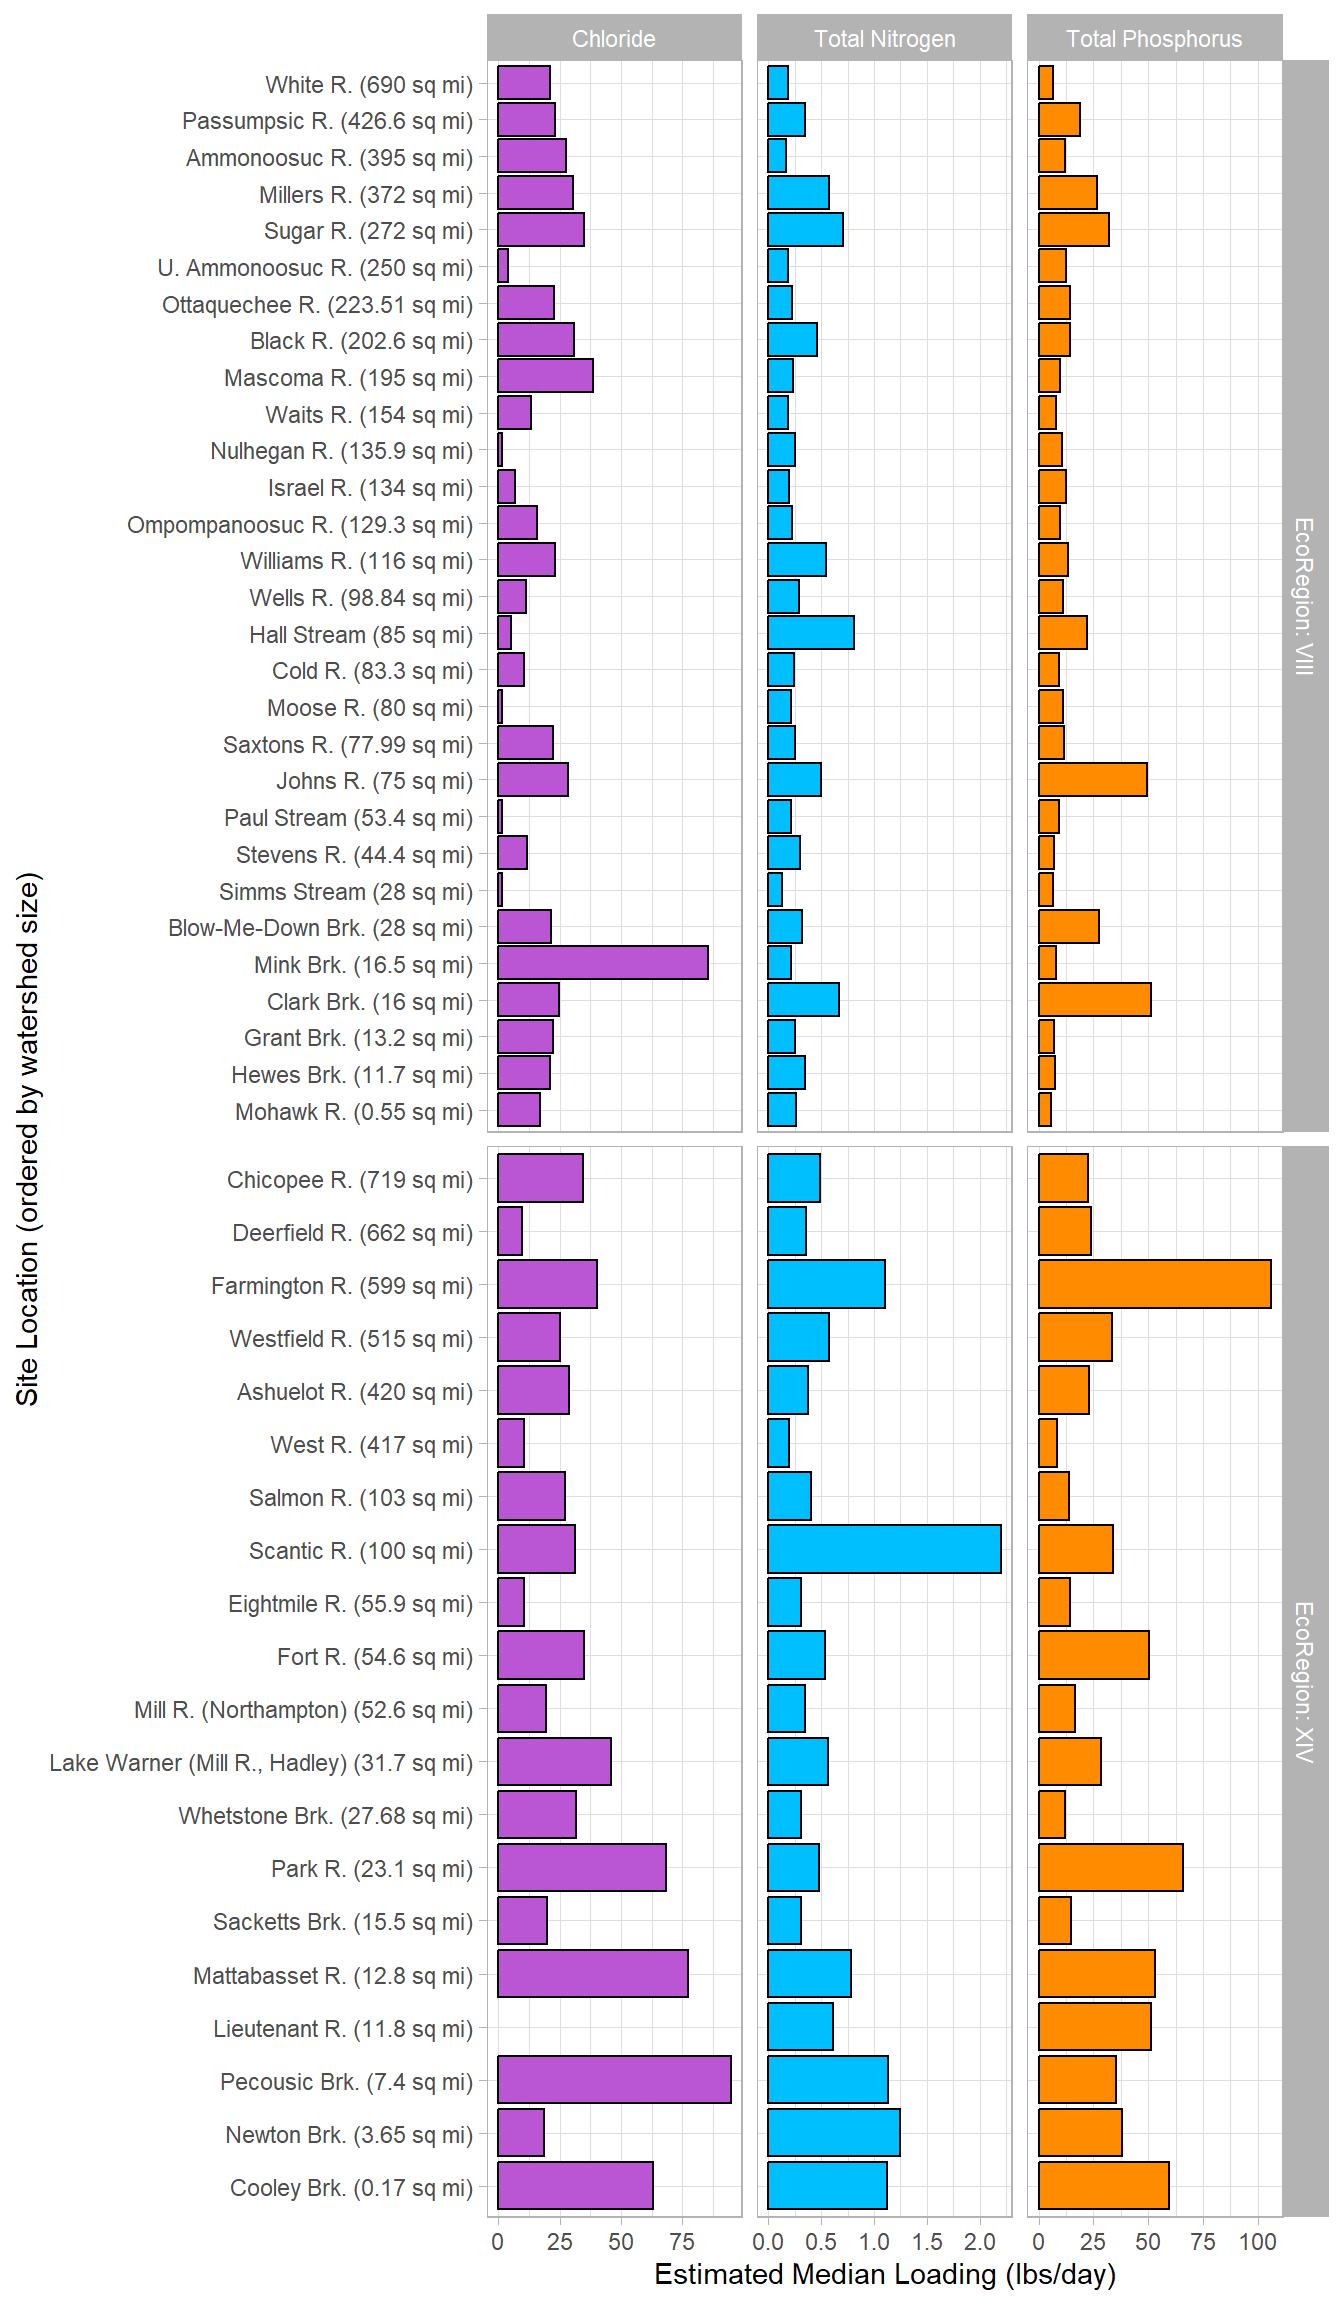
This chart is arranged by wastershed size instead of geographically; the largest watersheds are at the top of each EcoRegion panel. It presents only the median result, leaving out any exceptionally high or low results at each site and allows for easier comparison among rivers. With no human impacts affecting nutrient or chloride levels in a particular watershed, we would expect to see values decrease with watershed size and lower values in EcoRegion VIII compared to EcoRegion XIV.
Looking at the results in this way allows us to see which tributaries are contributing more than their “fair share” of each paramter. It is notable that many of the smaller watersheds (such as Mink, Clark, Pecousic, Newton, and Cooley Brooks) are contributing excessive amounts of all three parameters. These tributaries were usually selected because they are in urban areas and so there was an interest in understanding what they were contributing. Smaller, rural tributaries were less likely to be accessible or of concern to be included in this study. Also, the Scantic River and the Farmington River stand out once again for nitrogen and phosphorus, respectively.
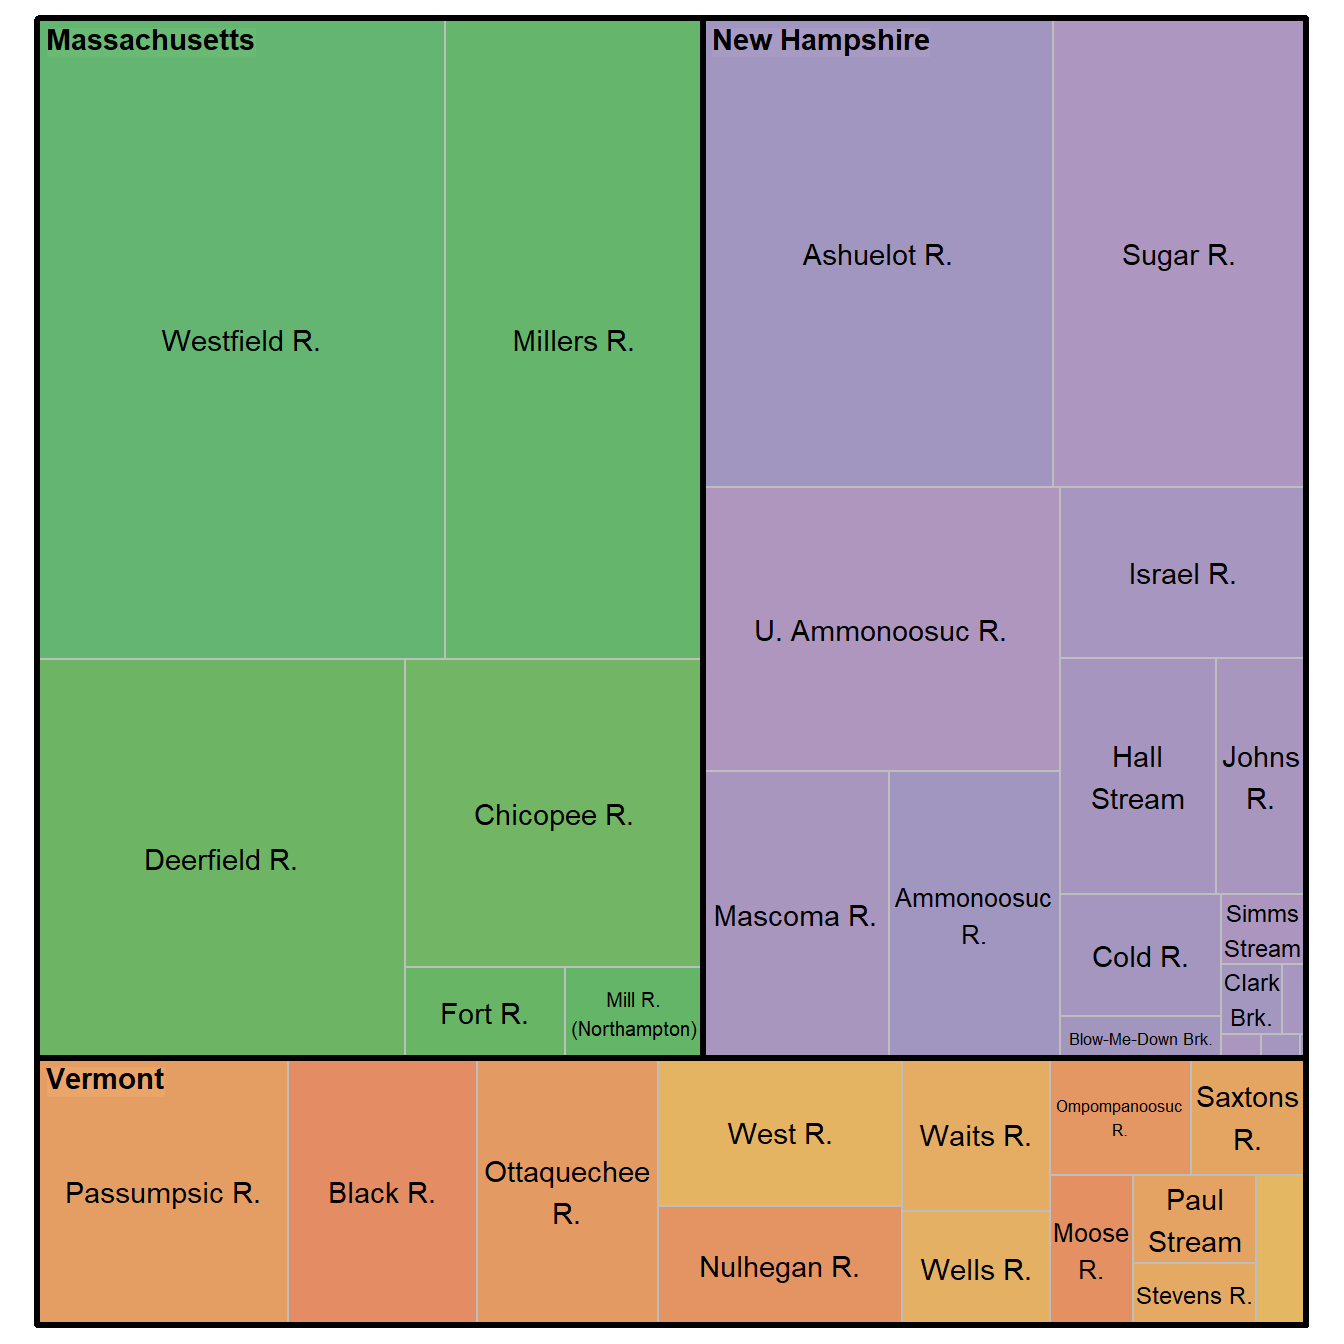
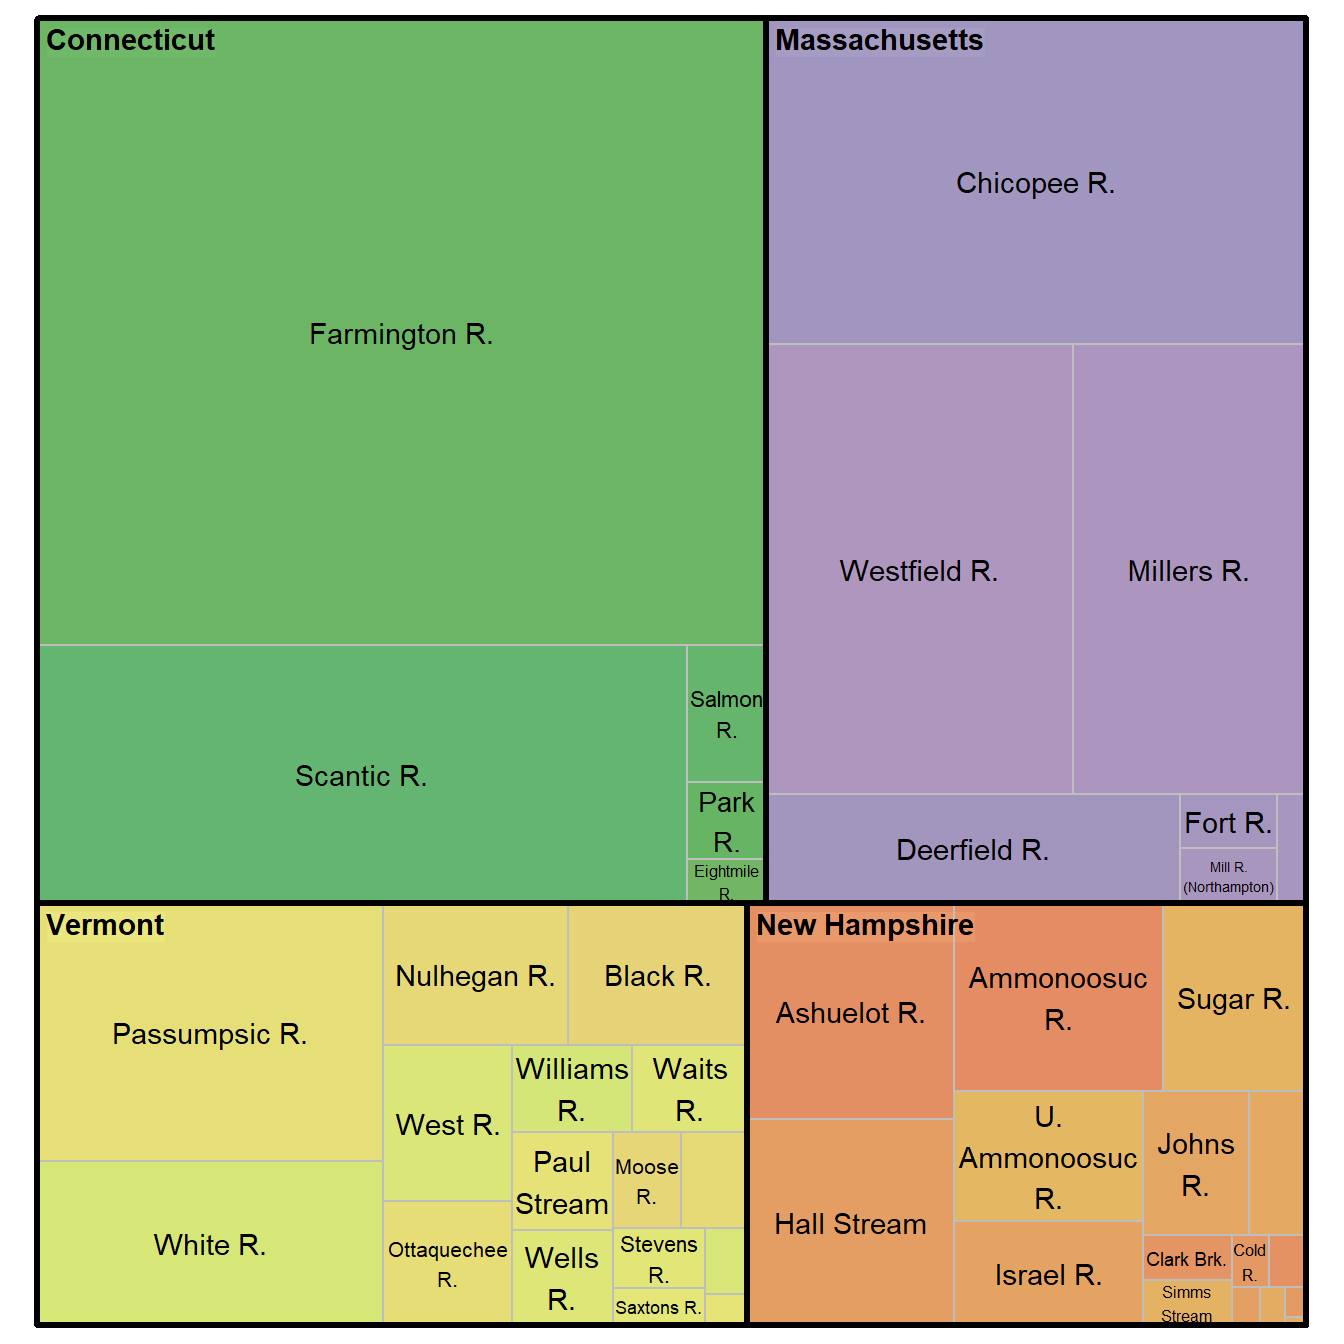
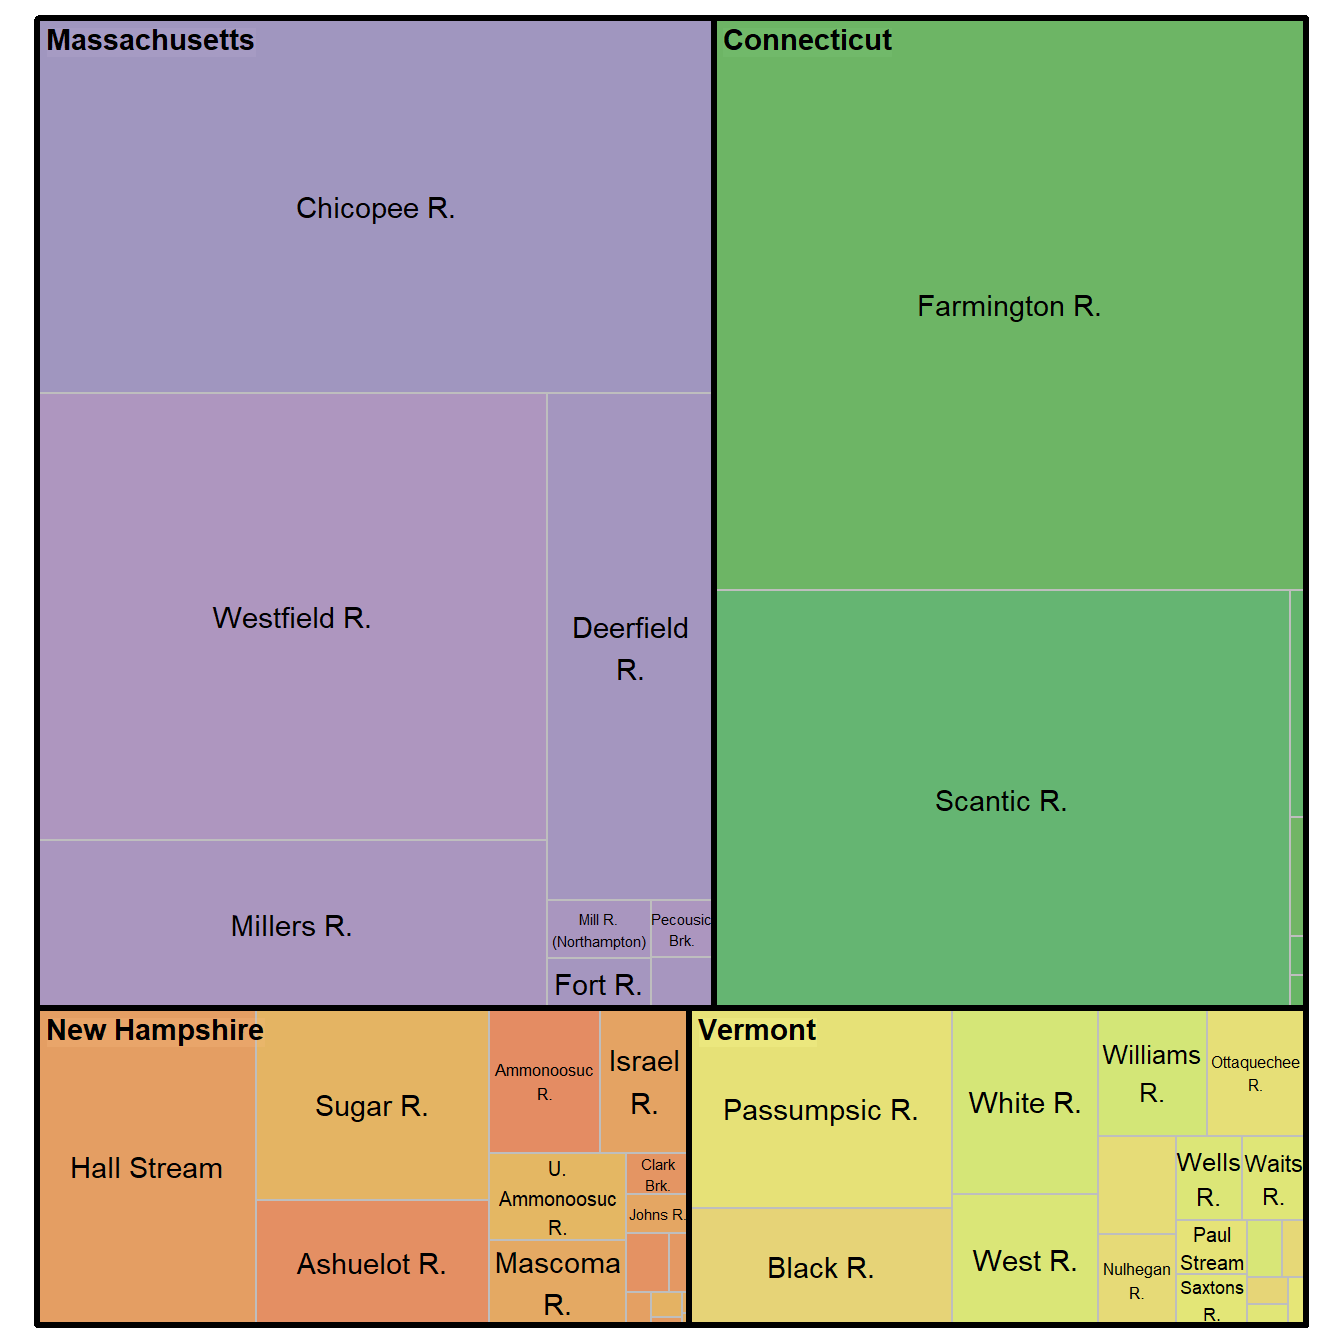
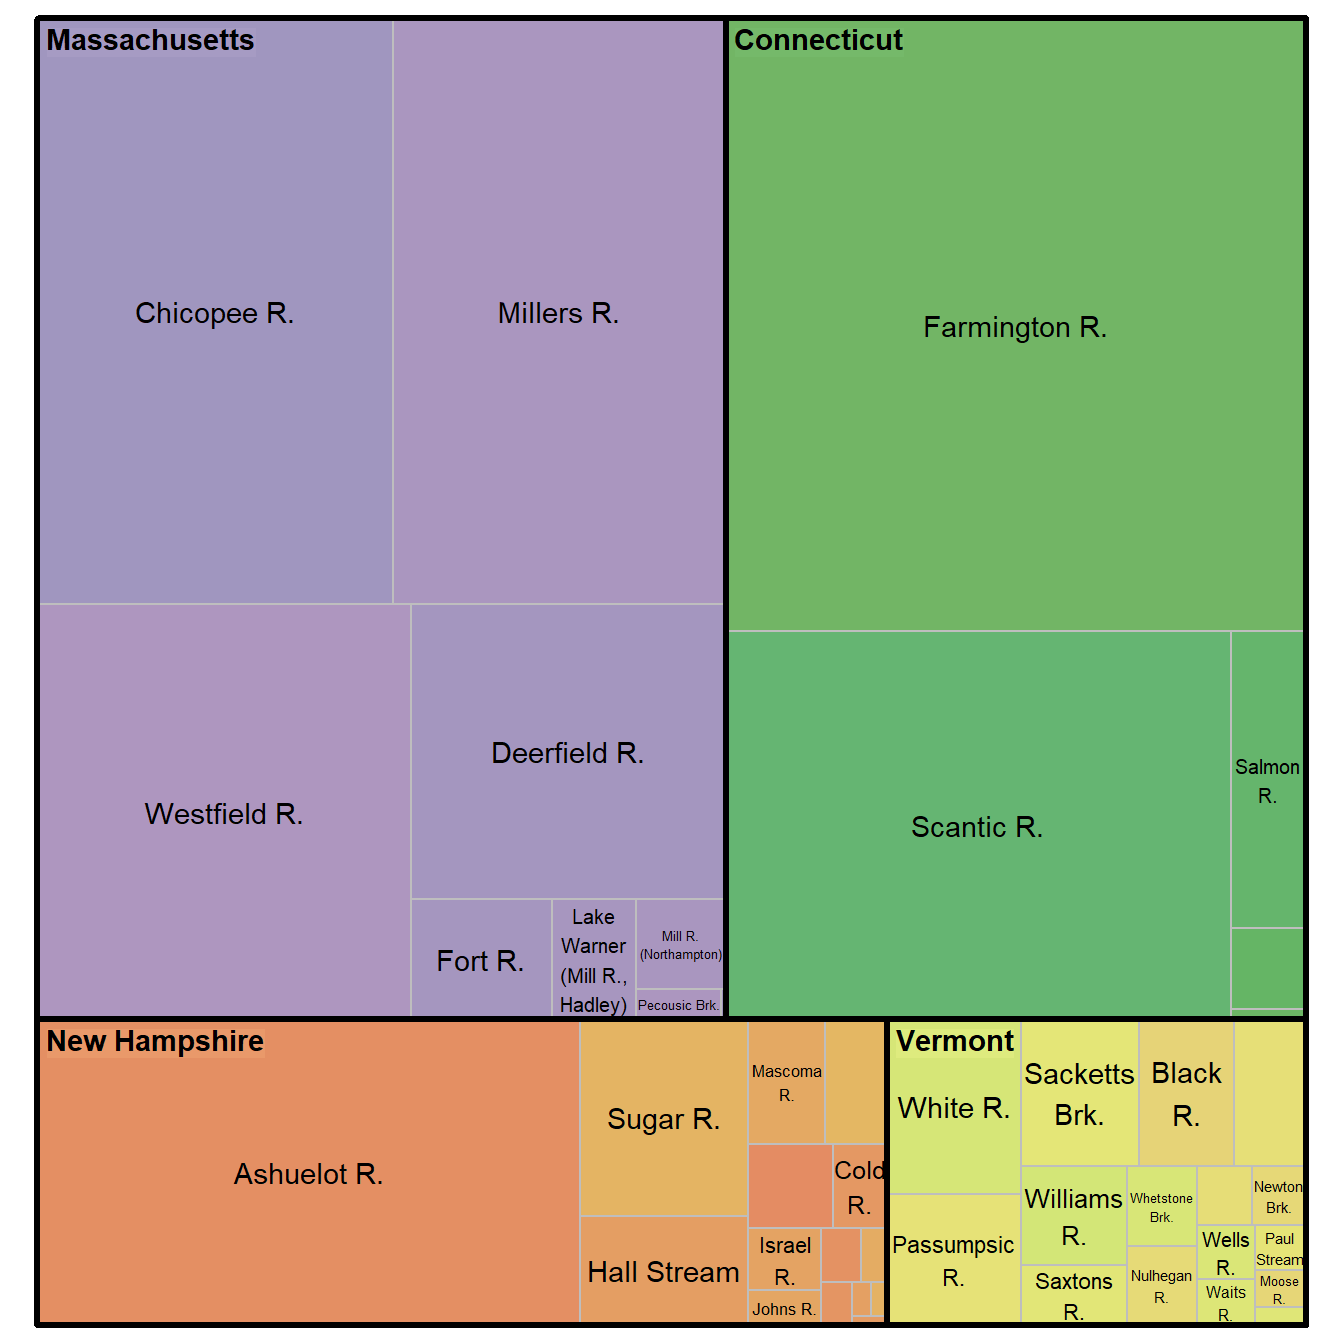
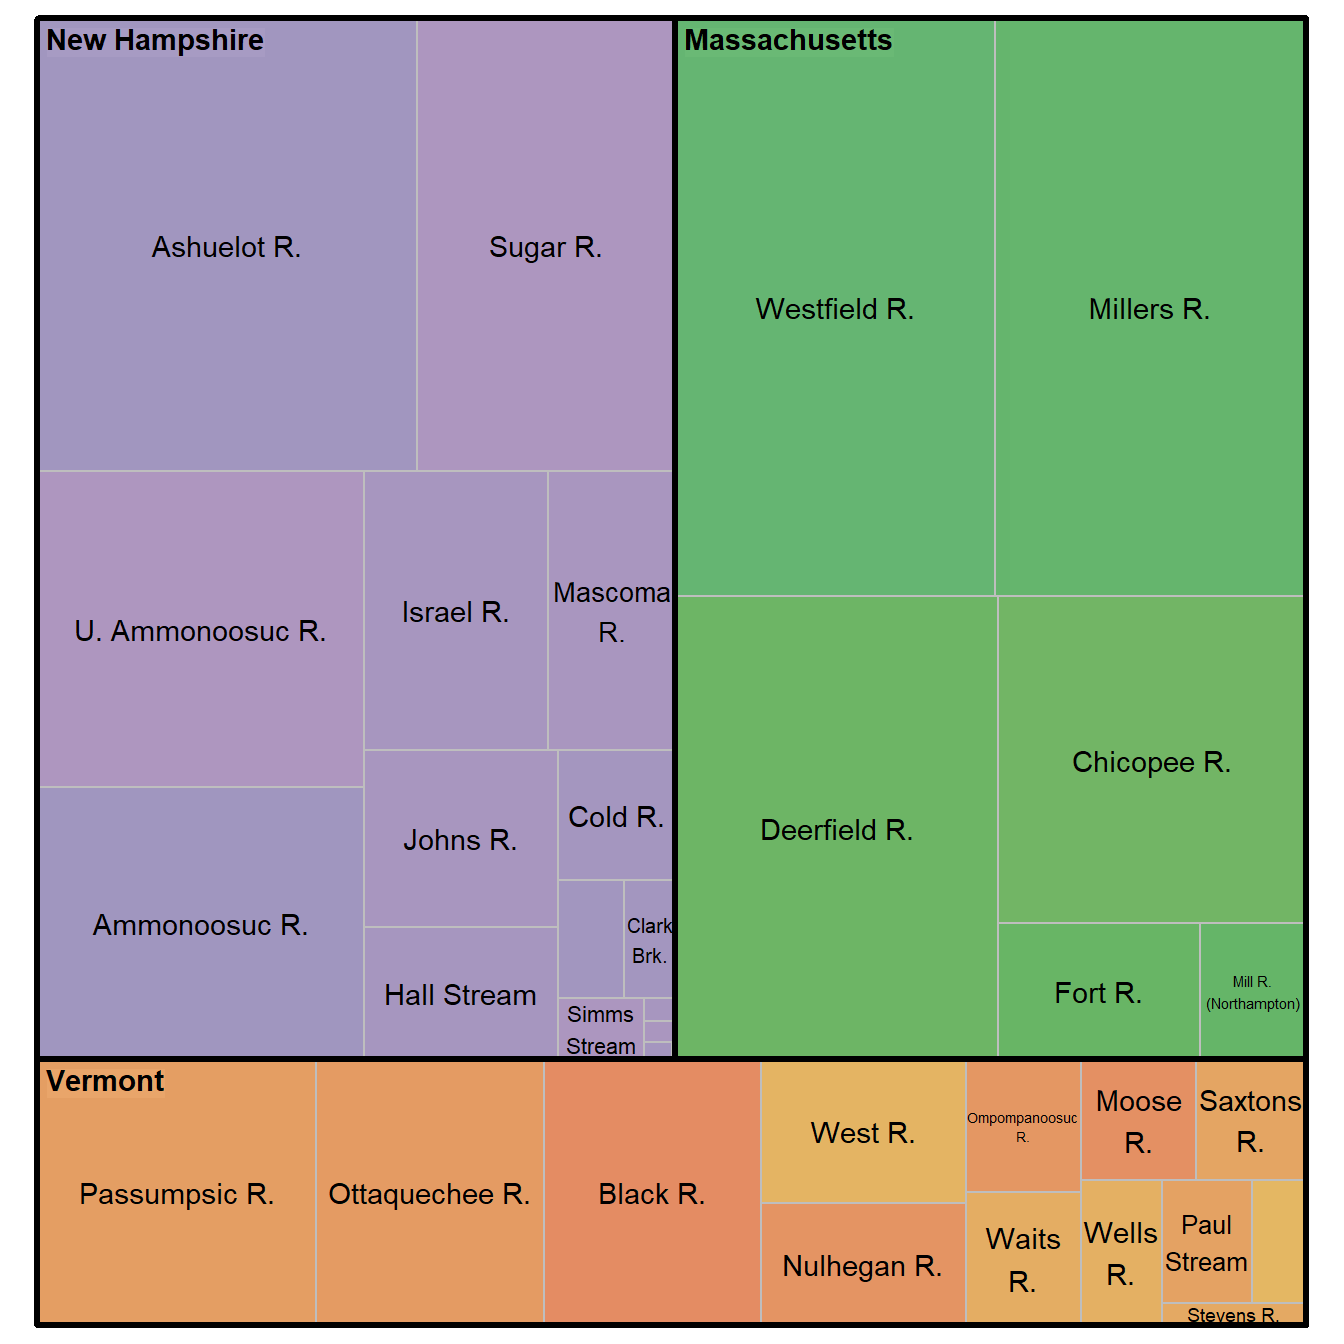
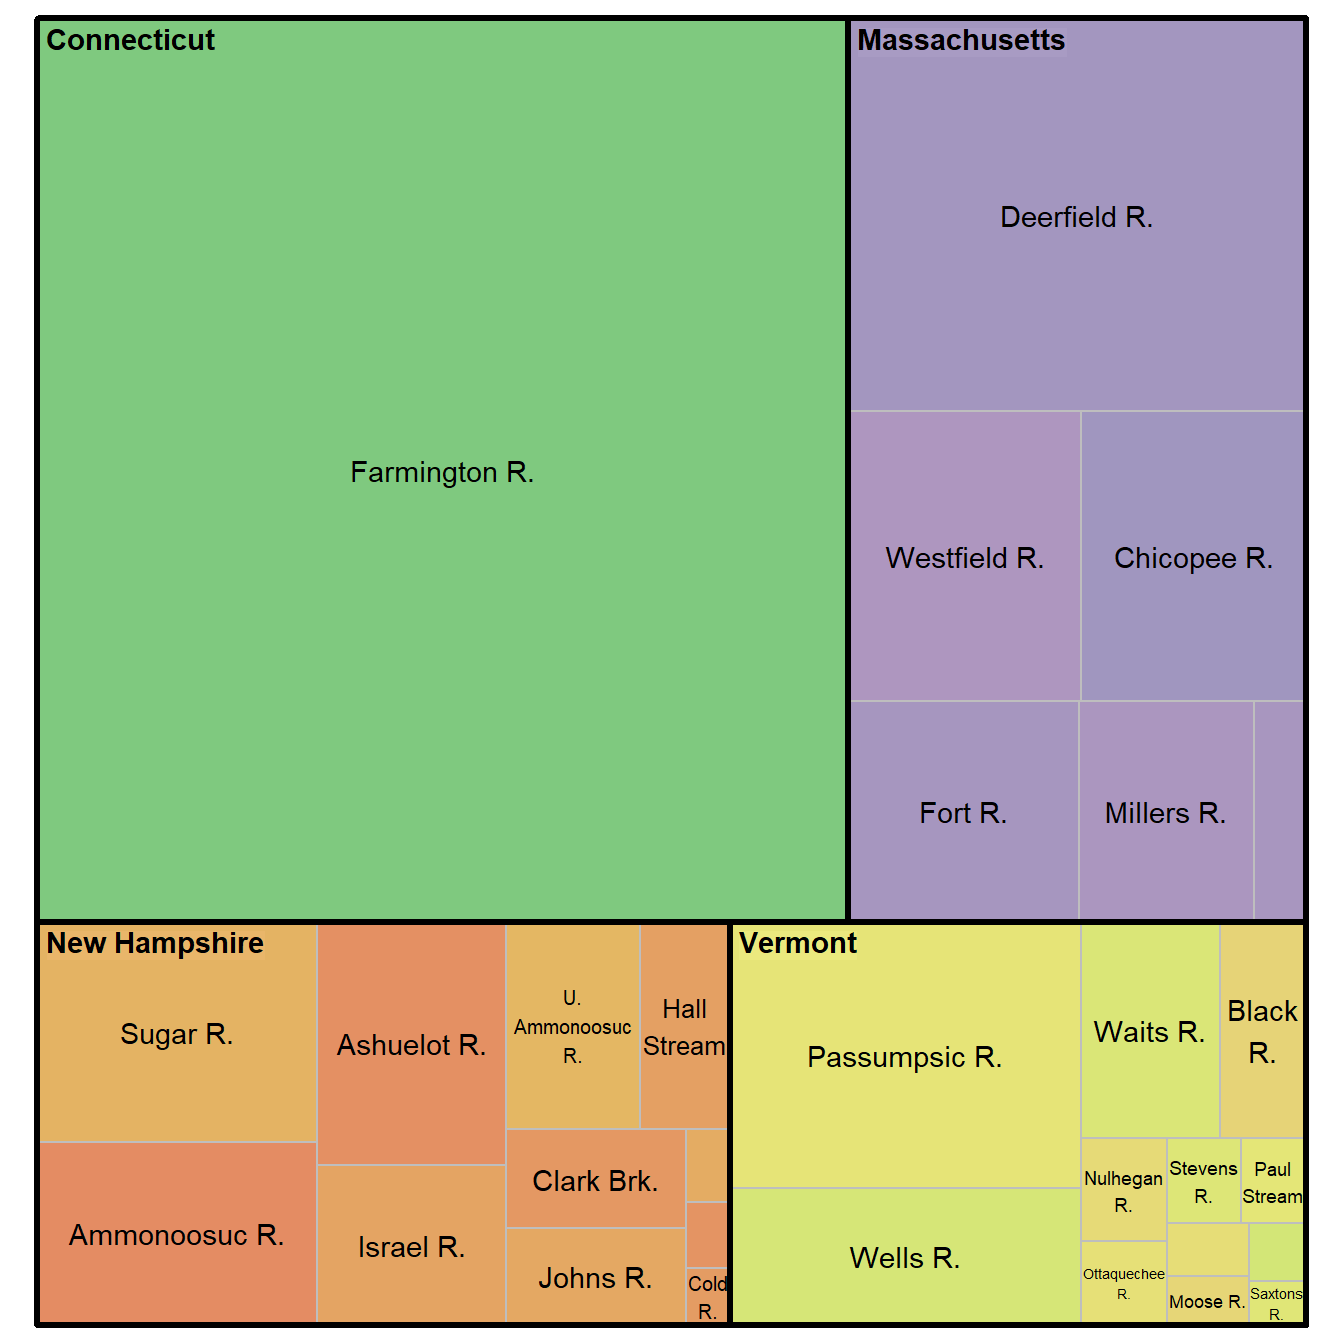
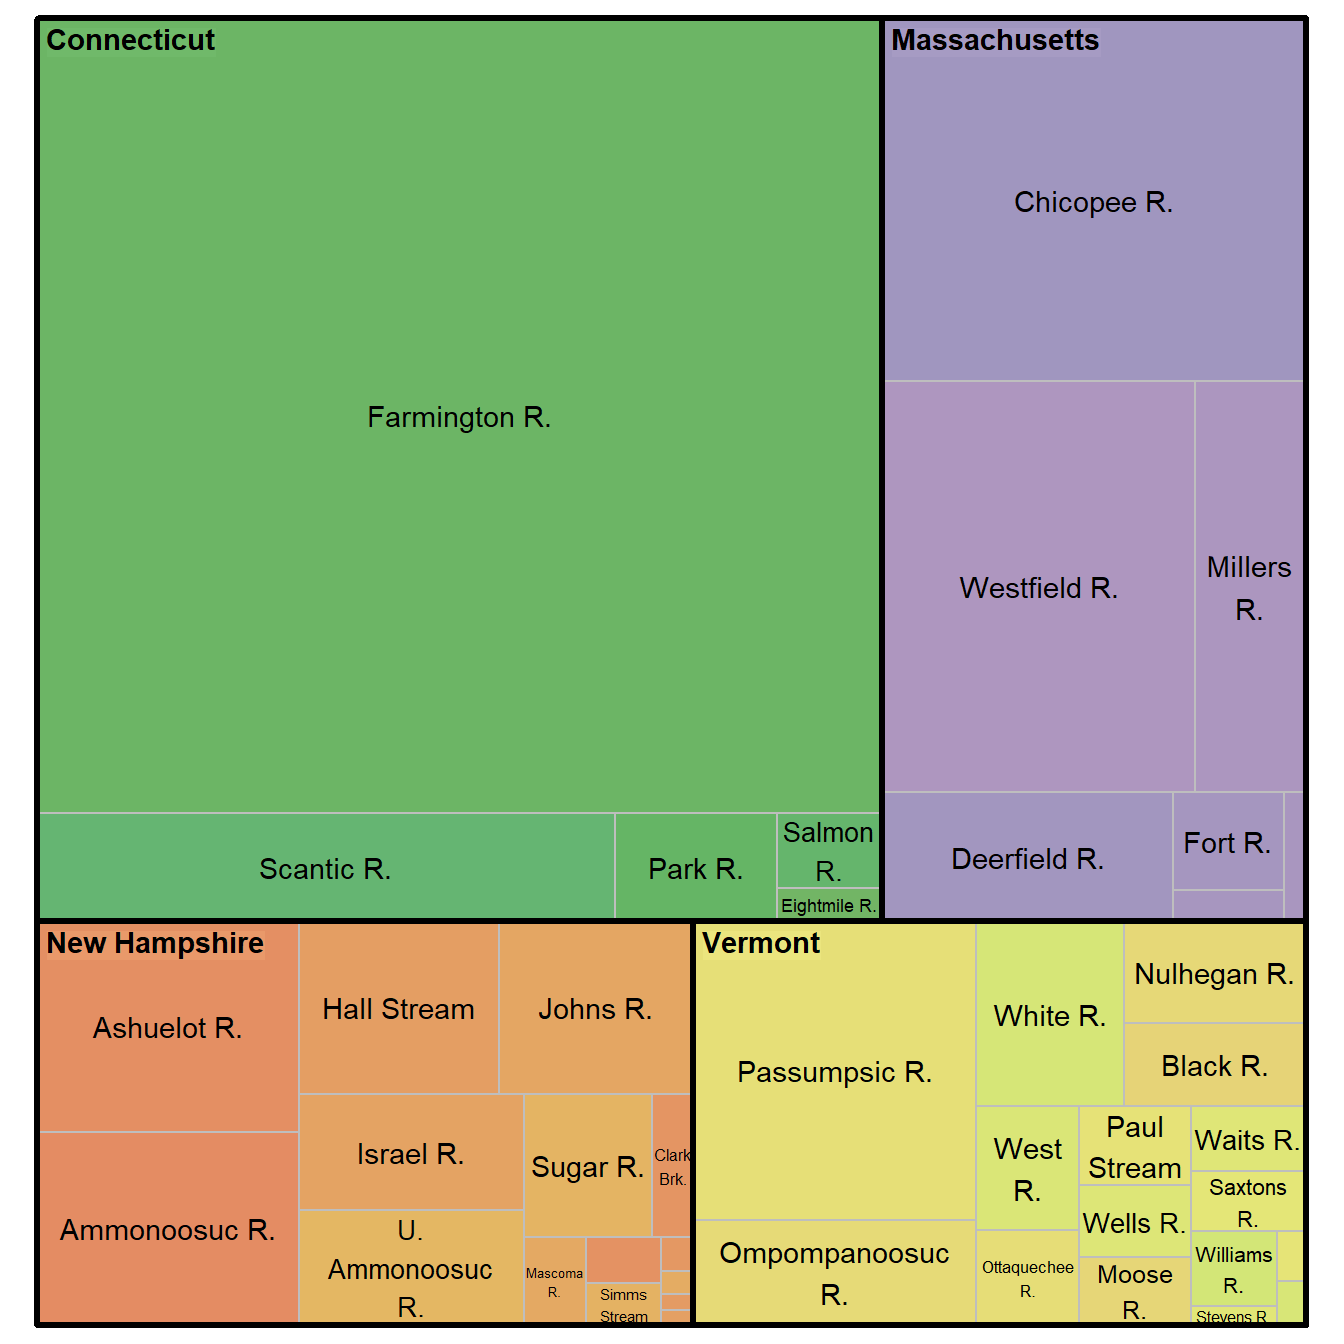
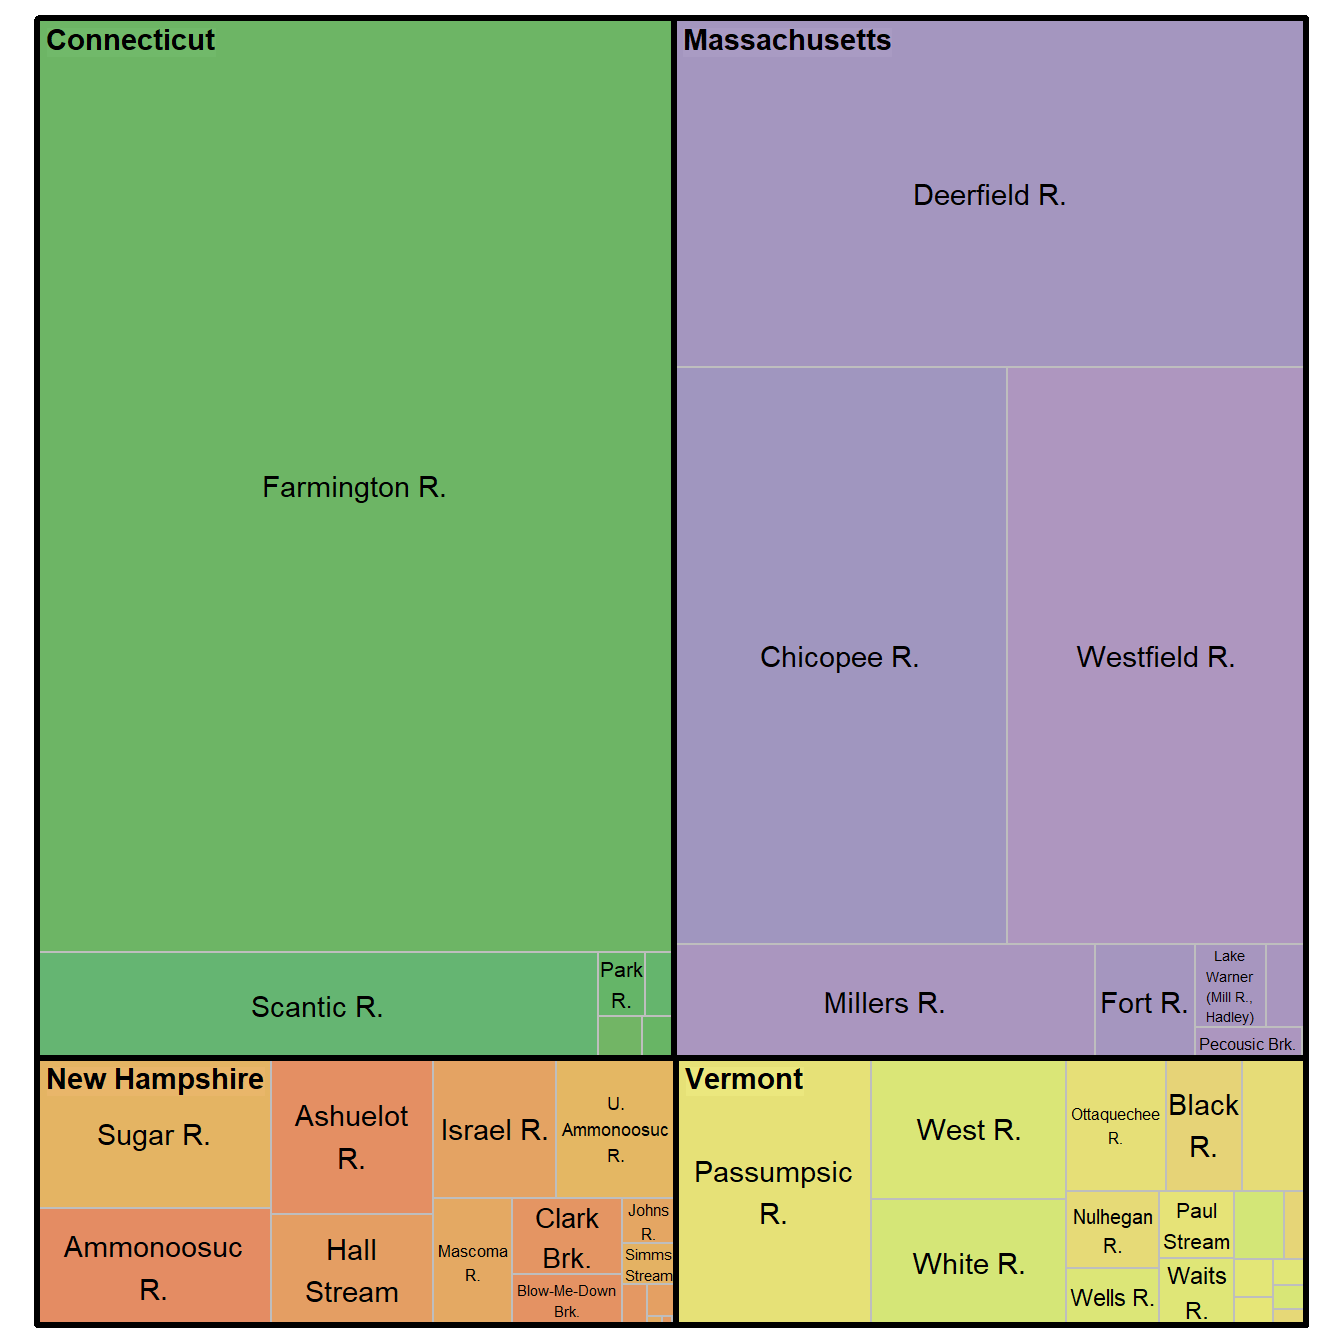
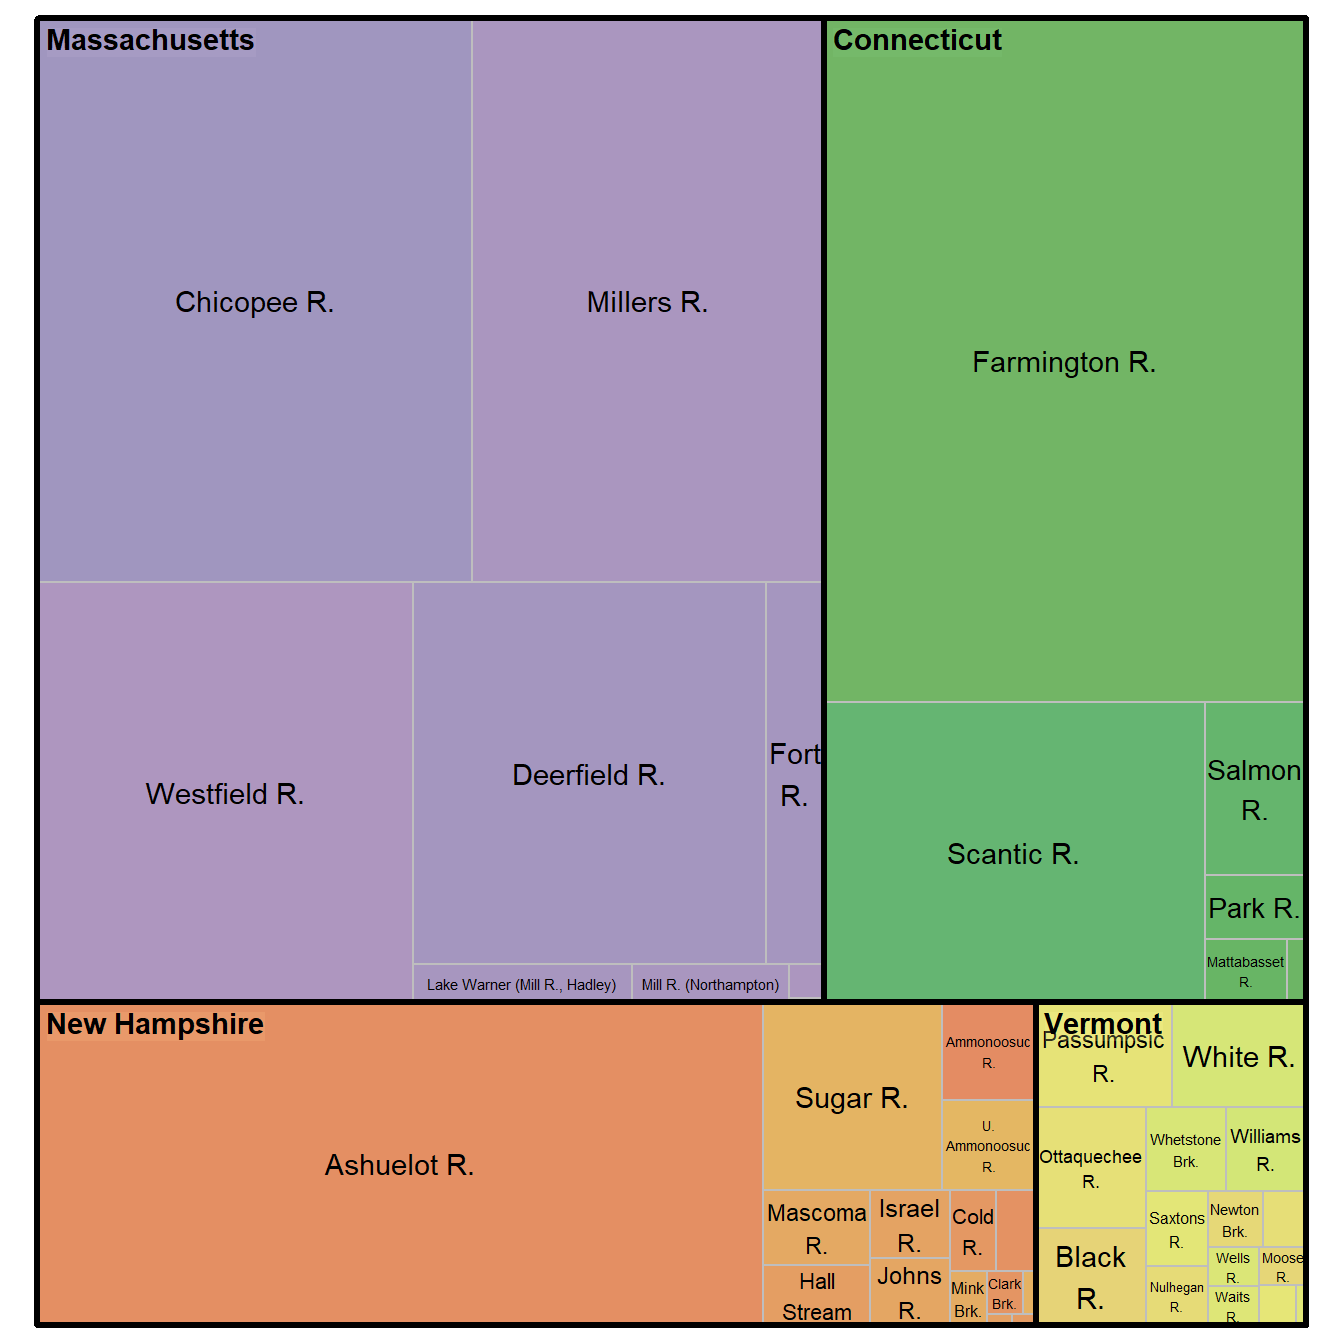
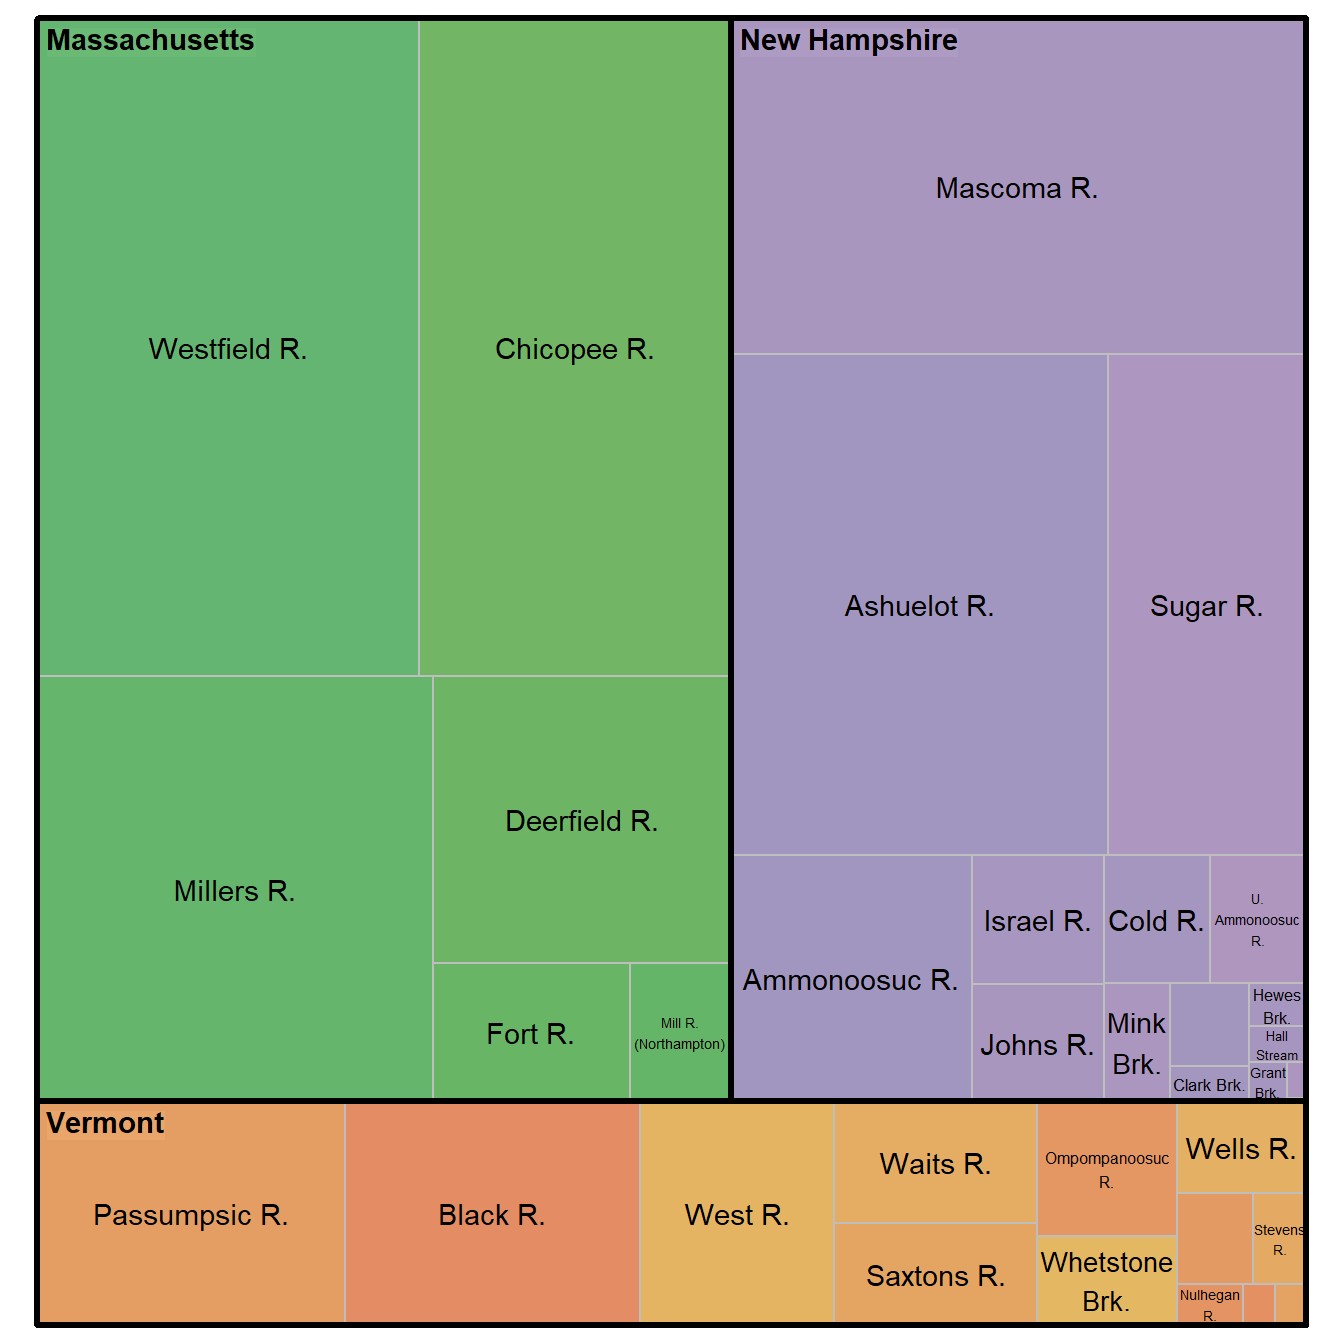
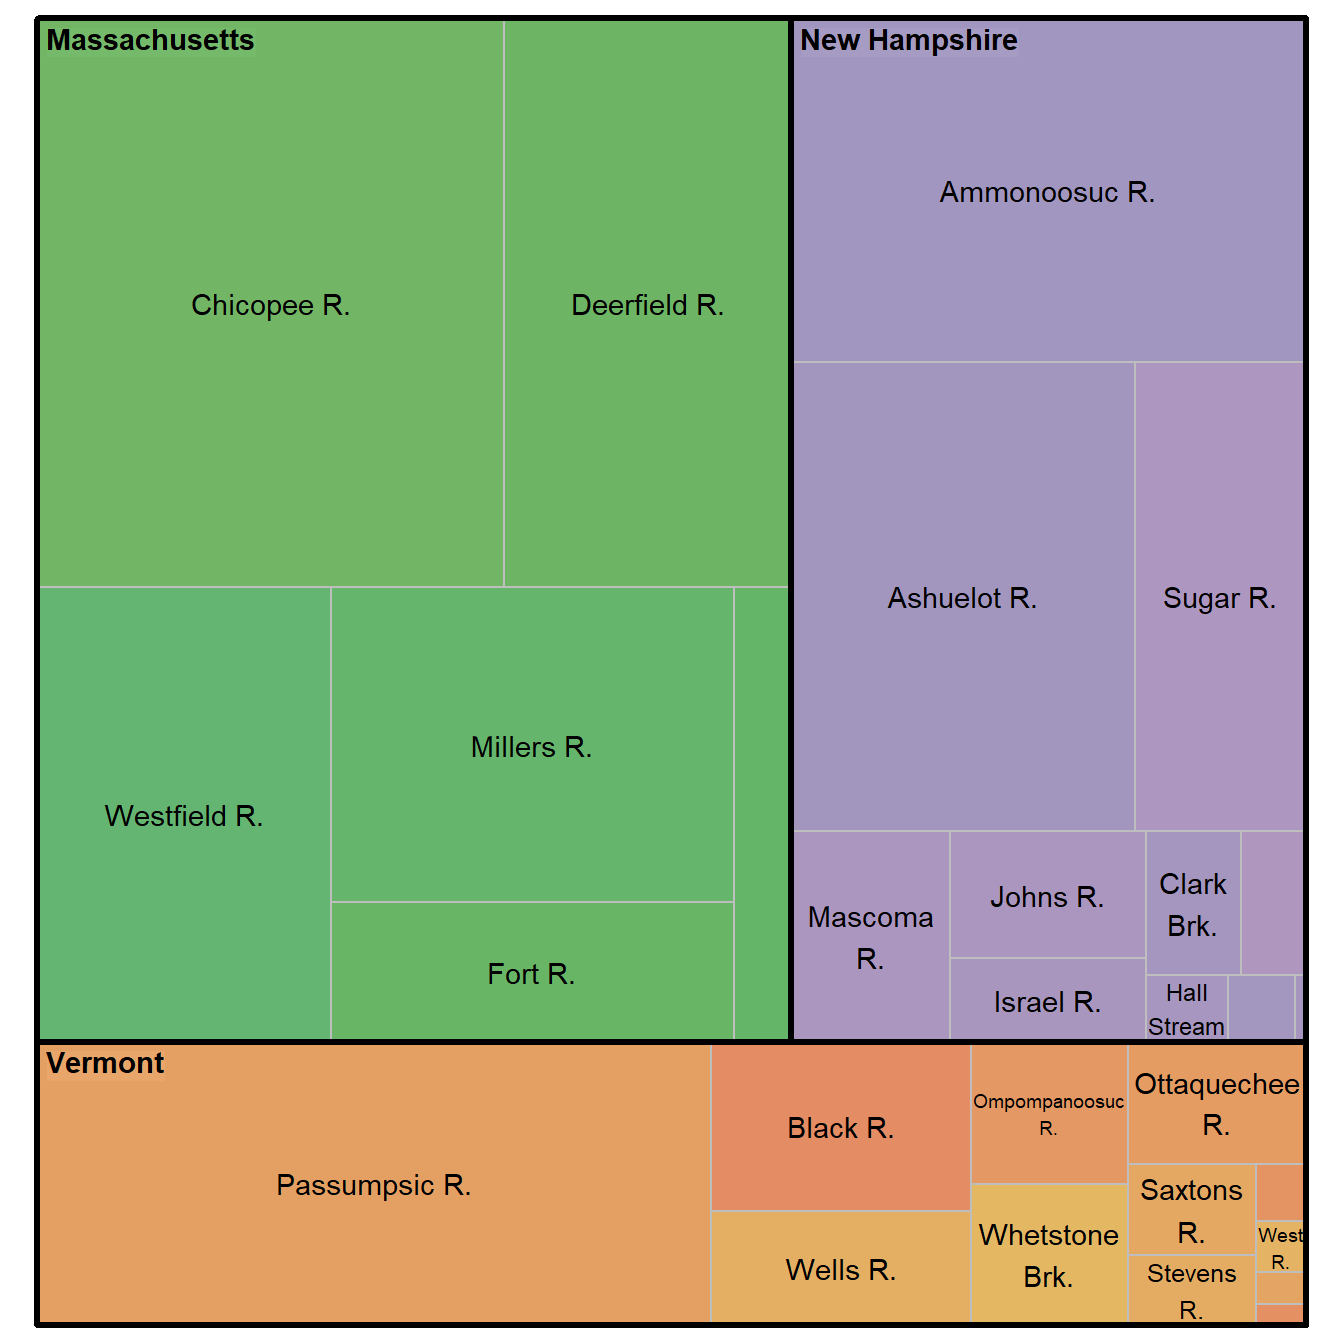
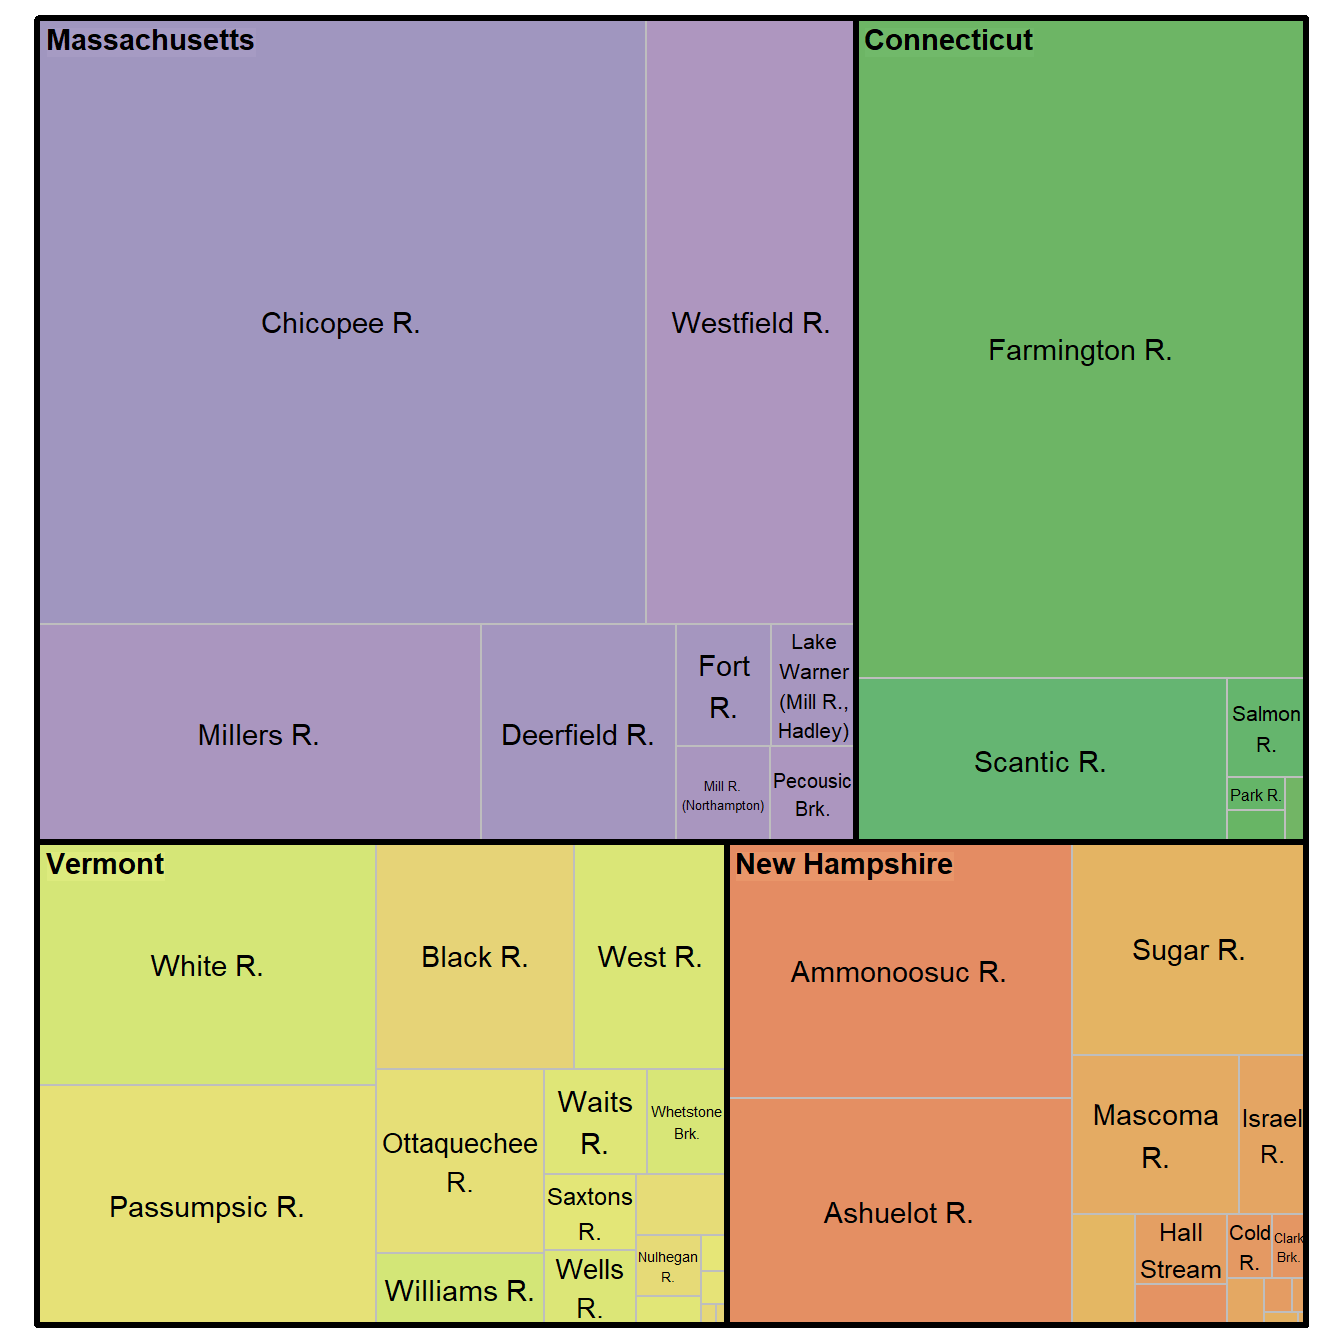
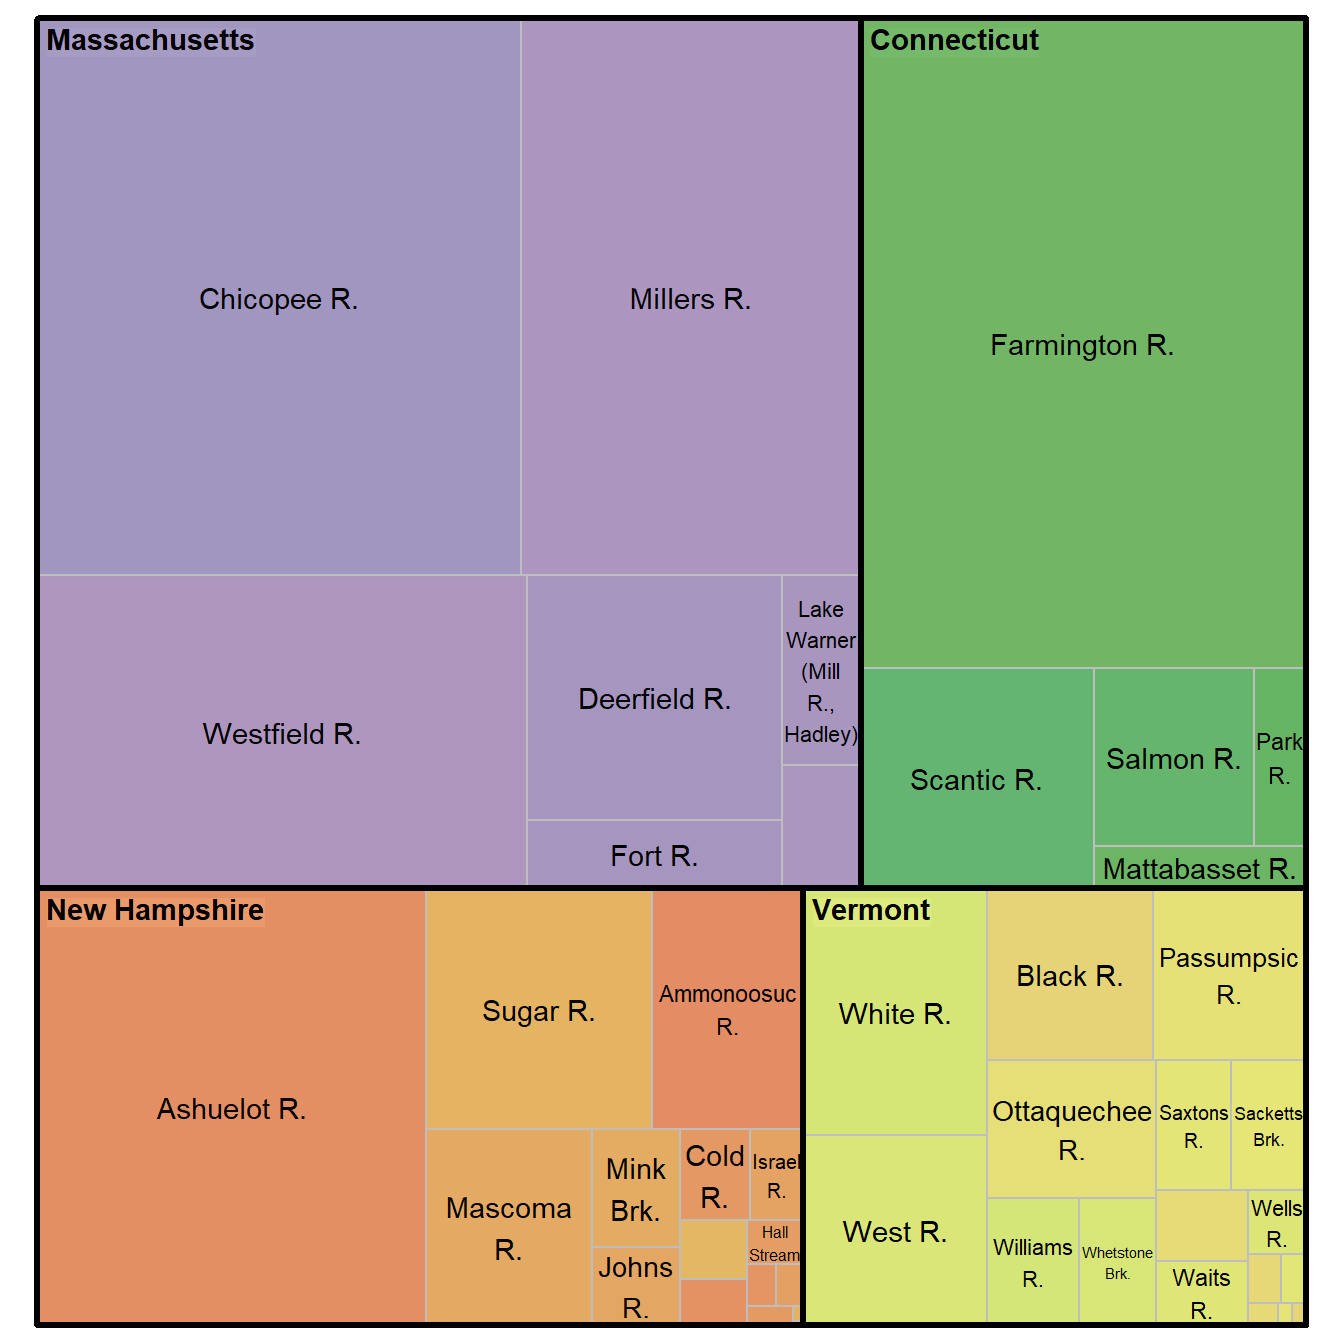
One of the goals of Samplepalooza was to provide a snapshot image of the entire watershed. Just like a picture taken every year at any group gathering, each year is slightly different with different conditions and different tributaries present. You can take a closer look at what each tributary was contributing from each state in the treemaps below.
Please note that the colors are not consistent for each state and that it’s impossible to know what the tributaries that were not sampled in each state were contributing via loading. Please refer to the maps above to see the geographic extent sampled each year.
The relative size of each box is determined by the estimated loading. Think of these charts as a square pie chart.
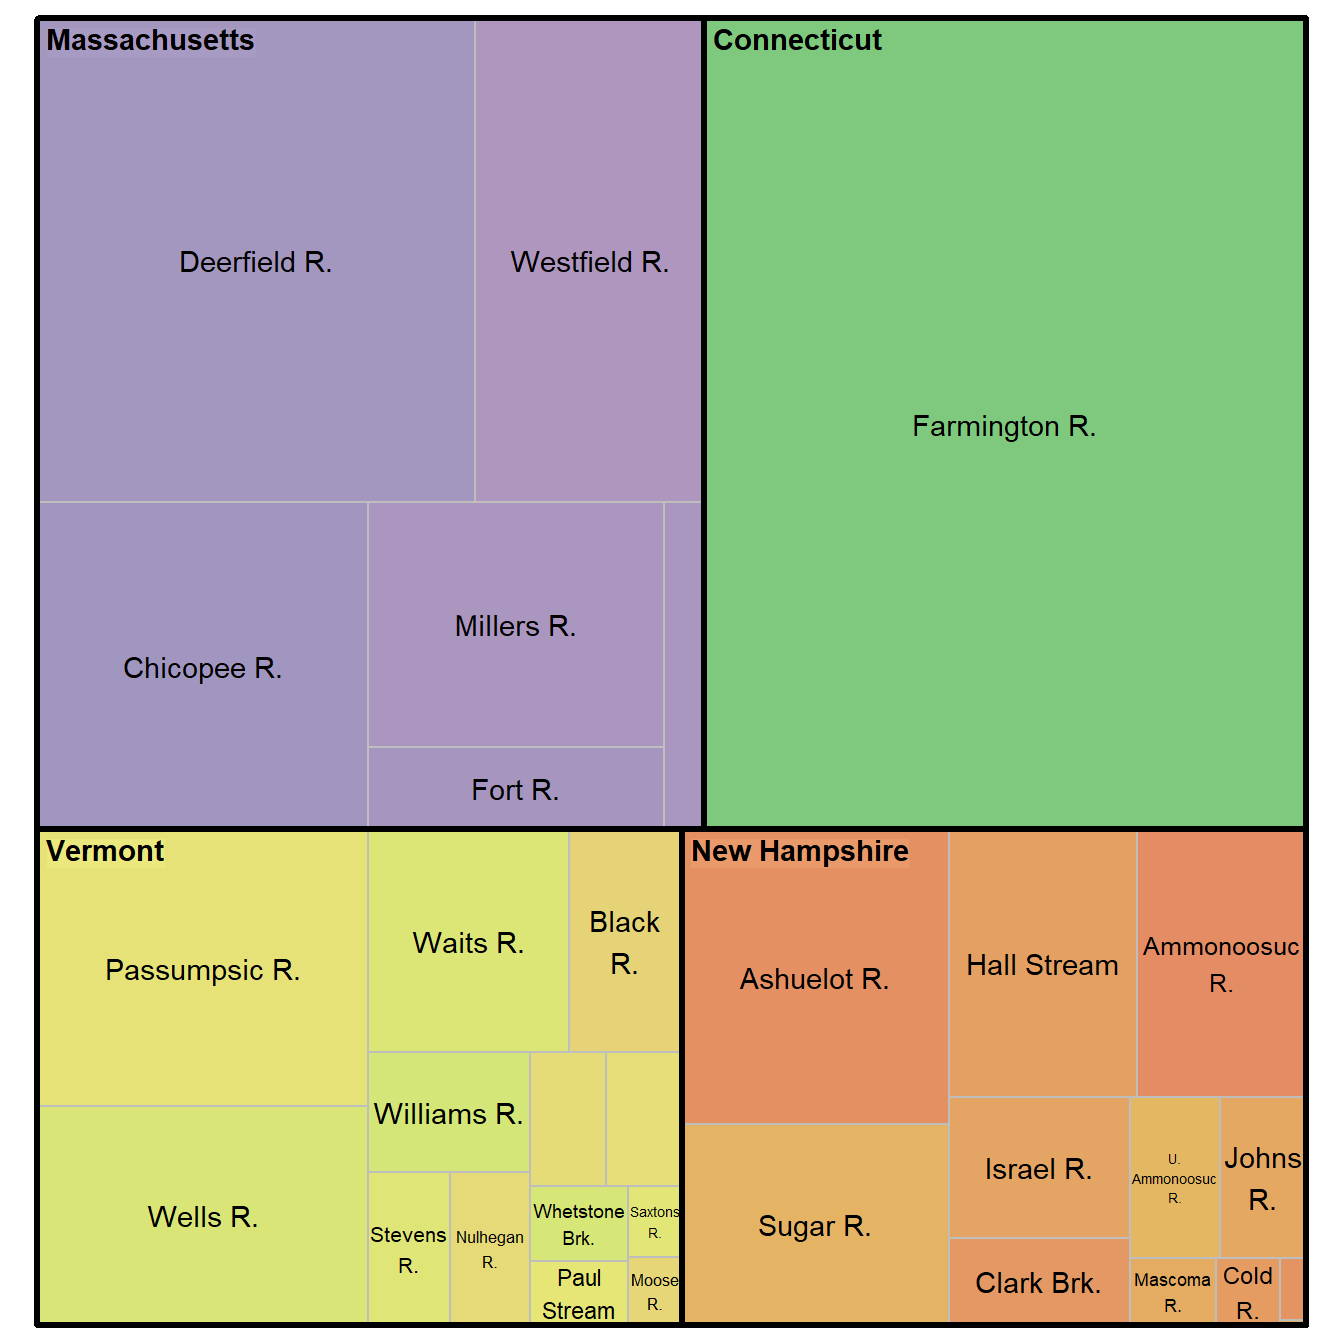
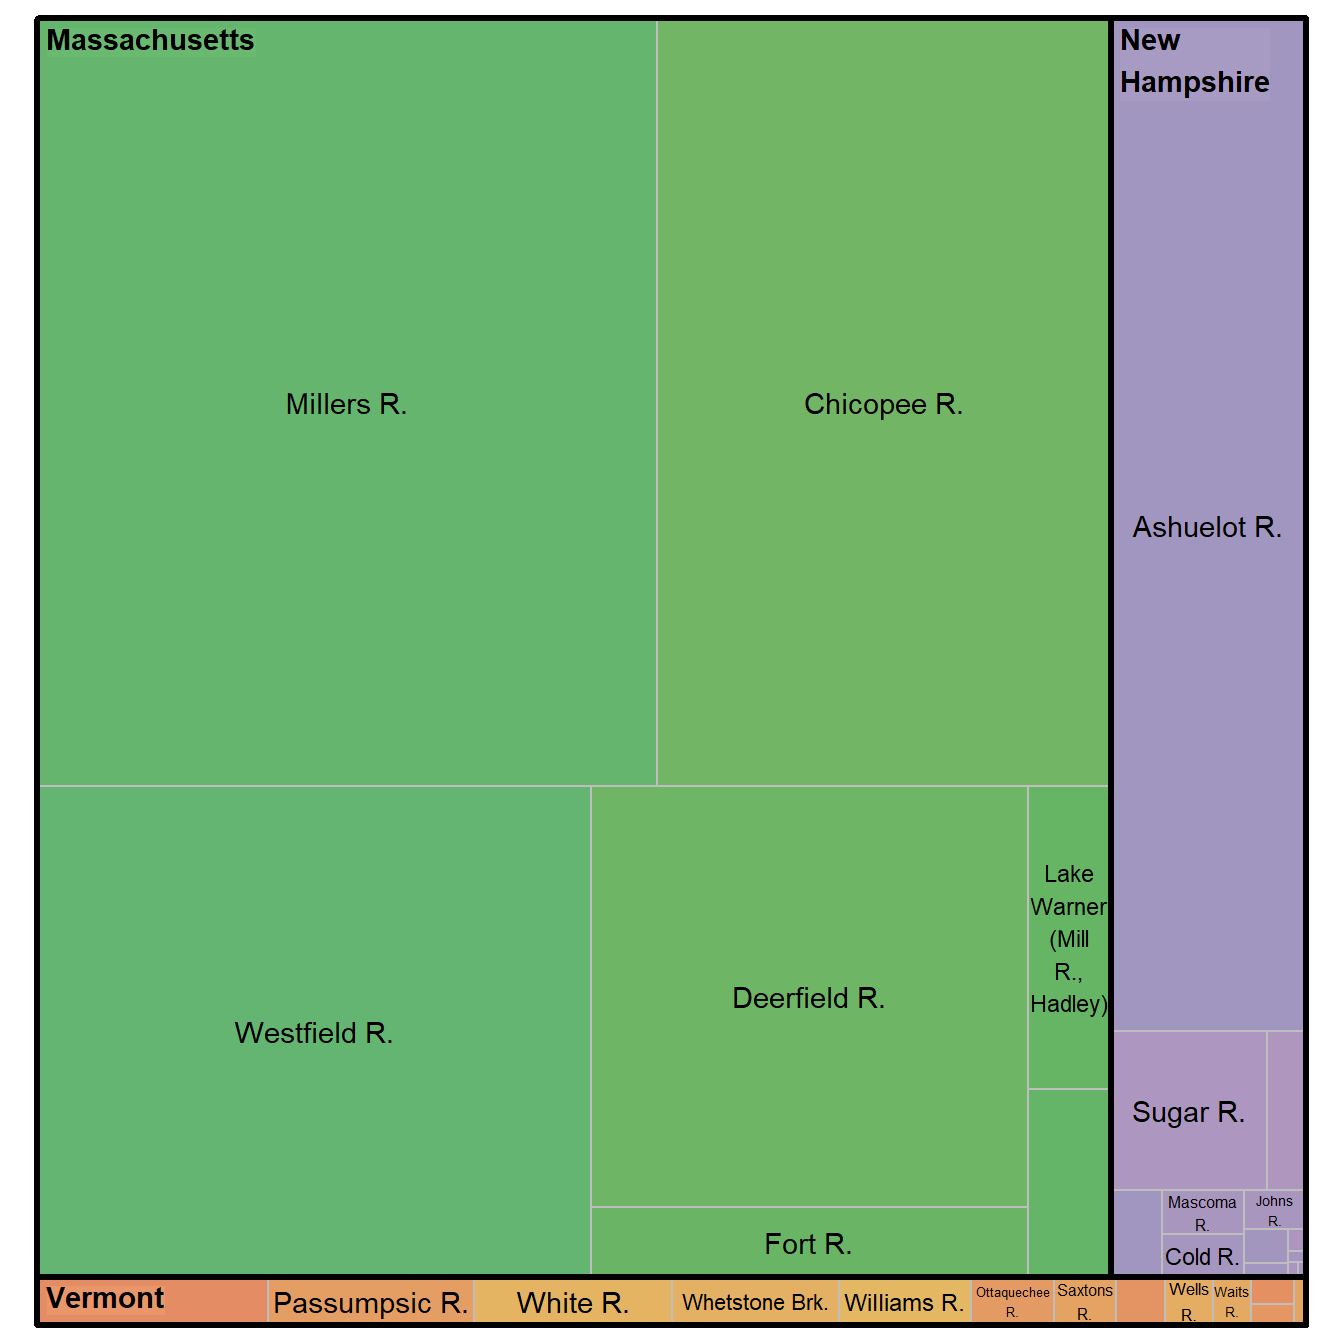
Note: The sample date in 2018 was immediately after a large rainstorm in only the southern half of the region with extremely low flows in the north due to a drought.
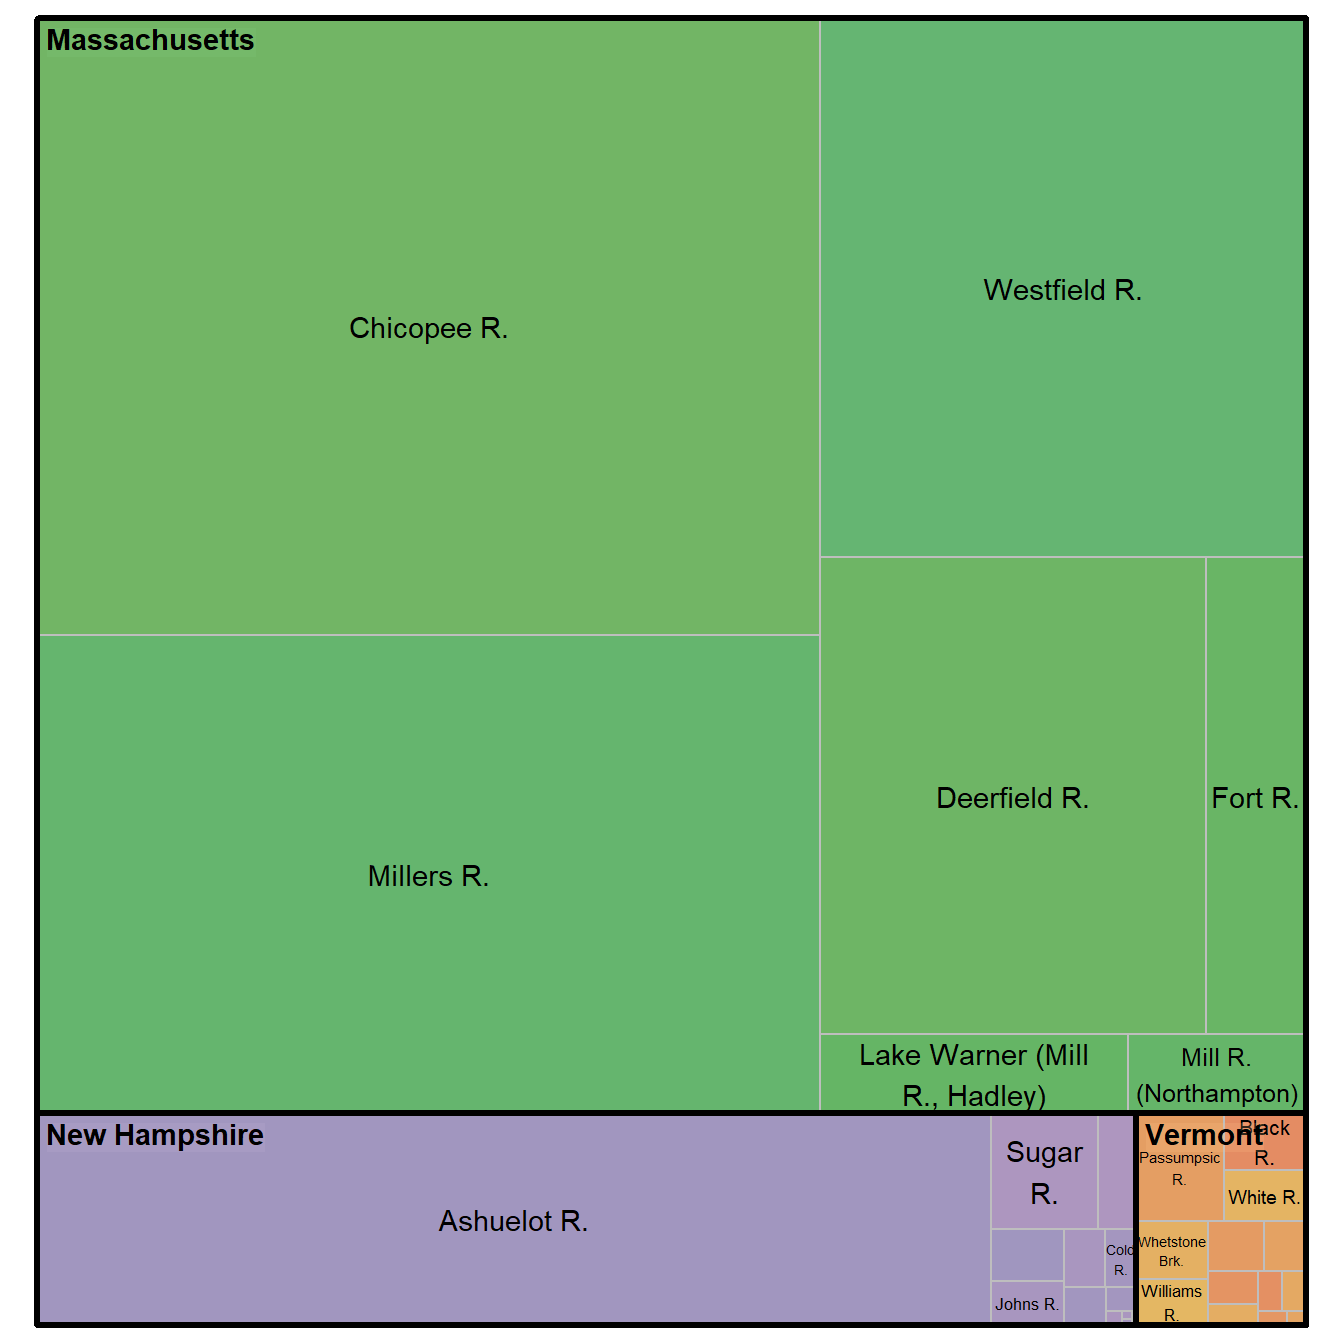
Note: The sample date in 2018 was immediately after a large rainstorm in only the southern half of the region with extremely low flows in the north due to a drought.
Samplepalooza was a successful project in collecting data to help understand the Connecticut River watershed on broad scale as well as an incredible exercise in collaboration across state lines. Since Samplepalooza started in 2014, regional efforts to monitor for and accurately model nitrogen contributions from throughout the watershed and to Long Island Sound have greatly increased and the usefulness of a single day monitoring event in contributing to the great body of knowledge has waned. While this iteration of Samplepalooza has concluded, we are excited to be launching a regional nitrogen monitoring program in the summer of 2024 to focus on getting a more clear understanding of less frequently monitoring tributaries, find and protect high quality waters, and bracket and track potential nitrogen sources. While the focus is on nitrogen due to Long Island Sound, any nitrogen reduction projects would ideally also reduce phosphorus and other runoff contributions.
Chloride monitoring was a secondary objective of Samplepalooza and is something that is of increasing interest to CRC and our constituents. As of this report, there is no concrete plan to increase chloride monitoring, but it is being considered.